Activities · Science of Learning · Teaching Methods

ABCs of How We Learn… U is for Undoing

“A bullet is dropped at the exact same time that one is shot horizontally from a gun. The bullets start from the same height. Which lands first?”

We know how this question goes when posed to students. Aside from the fact that we’ve primed them to answer one of the bullets, knowing full well the answer is “neither” we are leaning into student misconceptions, or rather an incomplete conception.

Students know, and are correct, that the shot bullet is initially travelling faster than the dropped one. Students also know, and are correct, that the shot bullet is always moving with a faster speed than the dropped one. Students also know, and are correct, that faster objects will travel the same distance in a shorter time than a slower moving object. All of these notions are true, and because students know these to be true, they will typically answer that the shot one lands first.

Well… except for those students who think about it a little more. See, those students reason that because the shot bullet is travelling faster and because it was shot horizontally, it is going to travel more distance, so perhaps the dropped one lands first due to its shorter distance.

Then there’s the one kid who of course has to say “air resistance!” in some way because fast things experience air resistance. Also not wrong.

Every bit of this reasoning is true until you get to the conclusion.

The issue here has to do with the fact that the reasoning and concept are incomplete. Students are not taking into account that the vertical properties of the two bullets are all identical, and since gravity, a vertical force, is responsible for accelerating the bullets towards the ground with the same vertical acceleration, they will land at the same time.

In a course where students are already coming in with preconcieved notions about who can do physics, the last thing we should be doing is blatantly demonstrating everything wrong with their thinking. Instead, we should leverage and aknowledge the good, while also giving them the tools to make a complete judgement.

Physics students come to us with a lot of incomplete conceptions, they want the ball to roll out in a curved path…

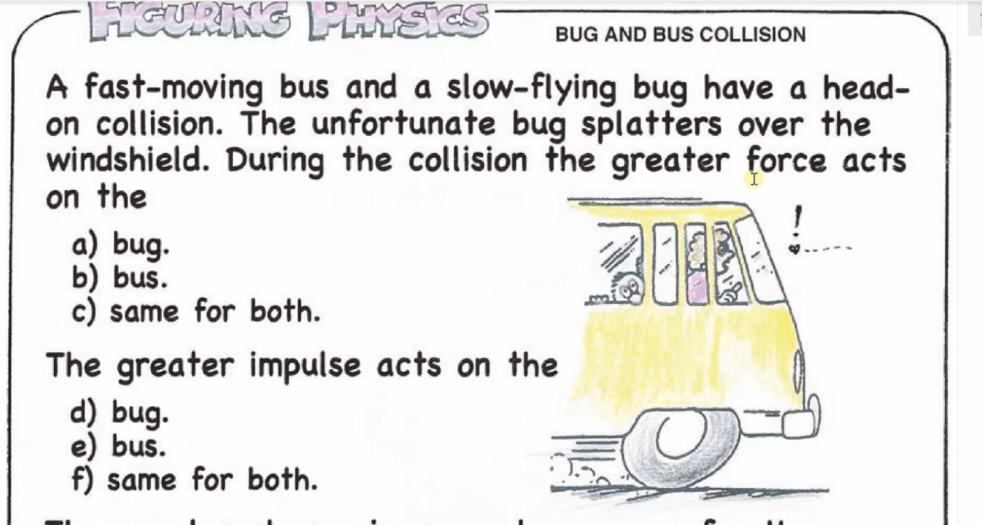
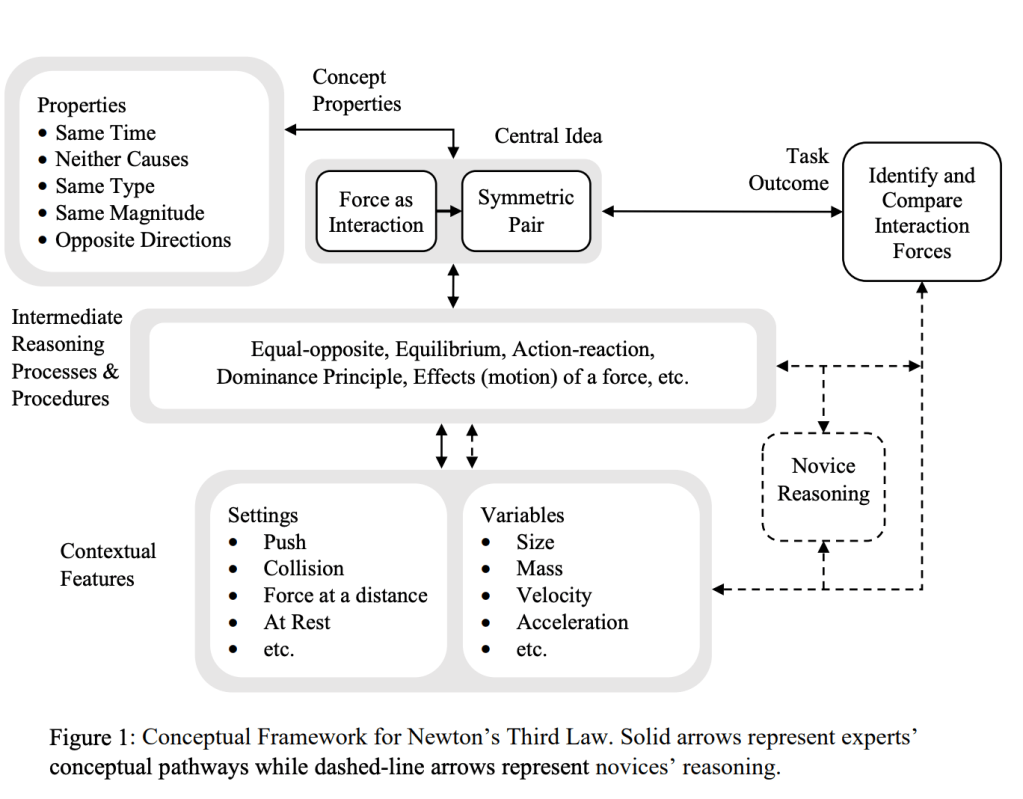
They want the force on the bug to be more than the force on the bus

They want acceleration at the peak of a projectile’s flight to be equal to zero, an object that flies out the window is moving backwards, waves should push matter, and more resistors to always mean more resistance.

Physics misconceptions are frustration for student and teacher alike because they are very much grounded in elements of truth and lived experience, but they are always incomplete.

Making these notions complete and providing many opportunities to encounter the complete notion is imperative to unlearning the previous notion. In order to do this we must:

  1. Increase student precision of thought; so they can reconize the difference between arguing with evidence vs intuition.
  2. Provide students with an alternative conception. This is where our representations such as force diagrams, motion maps etc. come in.
  3. TIME – students need time and exposure for the new conceptions to take hold.

This is a critical component built into the Investigative Science Learning Environment framework, and it is immensely effective at completing these conceptions. What I particularly like about ISLE is that when we are providing the alternative conception, especially for the first time, we are not leaving it up to students to just make the representation. Instead, that representation is carefully drawn through observational evidence.

Coming back to the original question of the two bullets, let’s discuss how the ISLE cycle approaches this particular conception.

In my class, I use the “three views of a ball” in pivot interactives for their observational experiement.

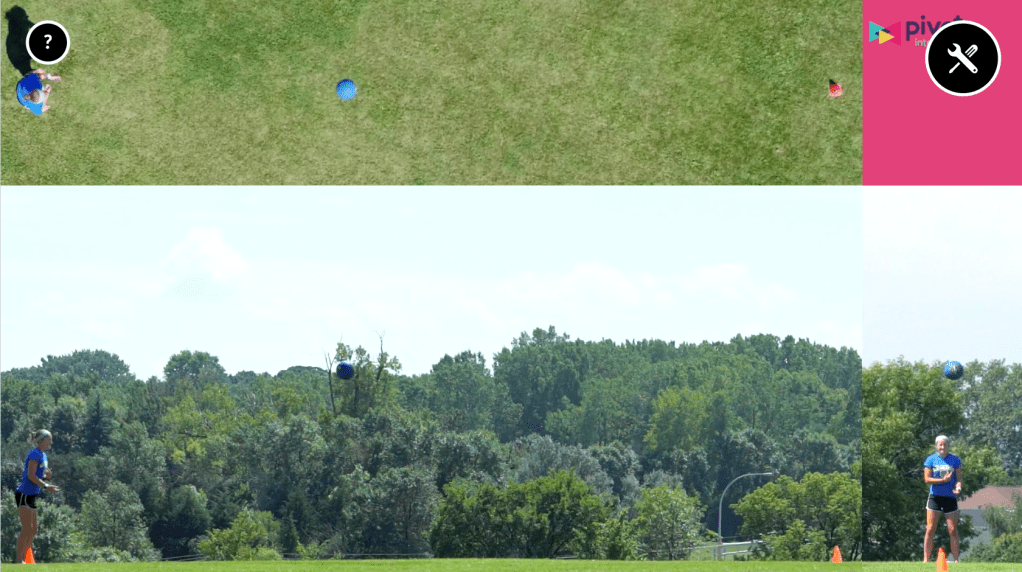
First, I ask students to construct the motion map for each of the three views. Even here students will sometimes rely on their incomplete conceptions over their observations. I will gently remind students to construct the maps based on the evidence in the video. (This is why we use an experiment!) How is the distance changing (or not) as the ball travels accross the screen? Be sure to represent it appropriately!

After students have done this, we discuss how the side-view actually works (Just in Time Telling!). It’s a composite of the top and front views. That is, the top (horizontal motion) is totally constant. This makes sense because there are no horizontal forces (I do projectiles after forces). The front view looks like an object experiencing gravity.

When students get the question with the classic ball drop demo (now a testing experiment rather than a demonstration) instead of just asking the question about landing, I ask them to first carefully construct the motion map for each ball based on what we’ve just learned and discussed then make their prediction. They should then be able to explain the reasoning for their prediction based on their motion maps.

Students all come to the agreement they should land at the same time.

In this manner of approaching the misconception, we have equipped students with tools to support their thinking, and forced them to slow down that thinking so they can achieve success at reaching a final answer.

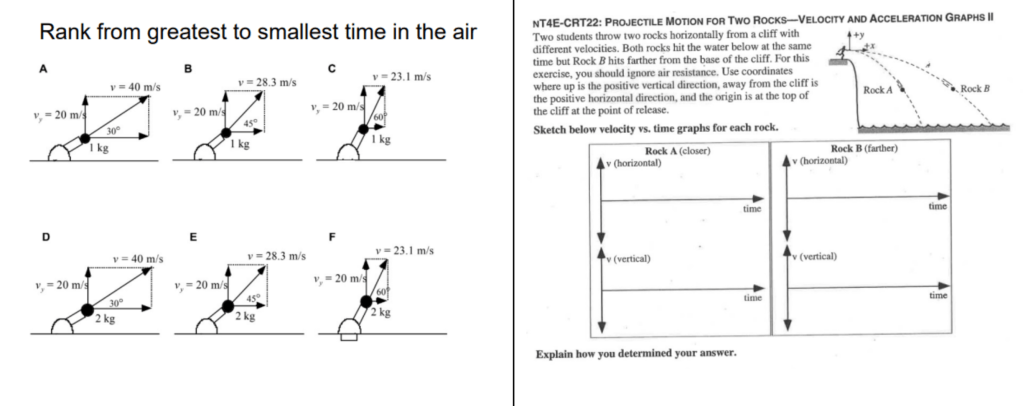
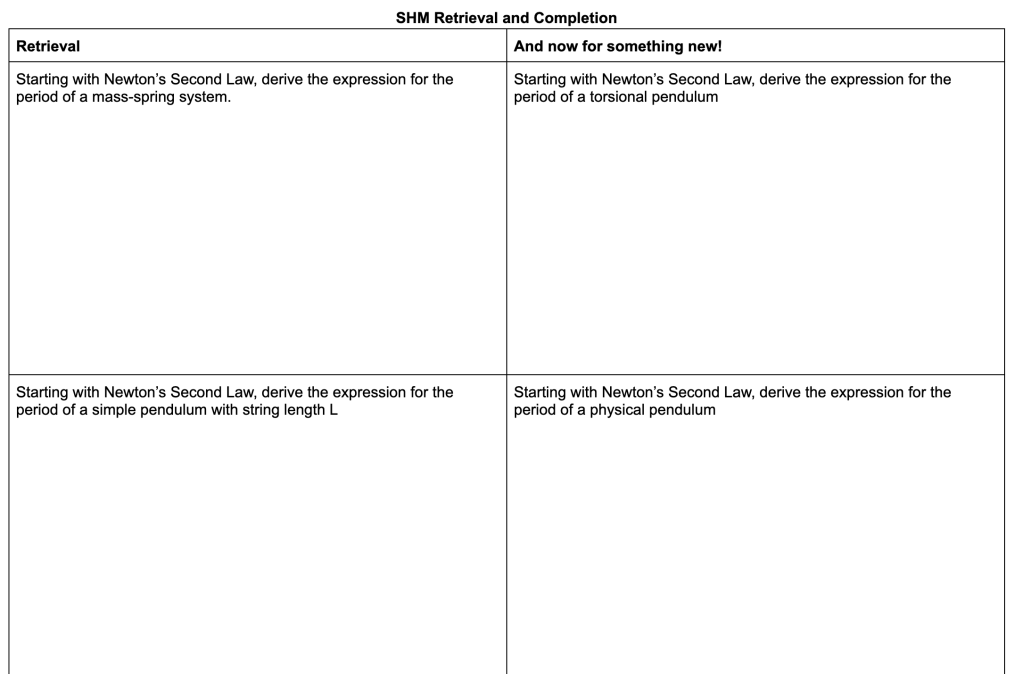
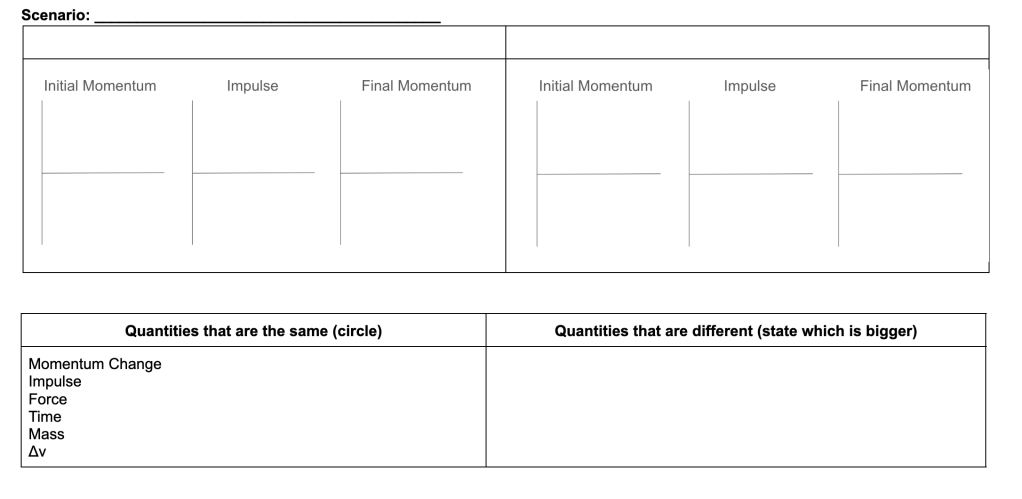
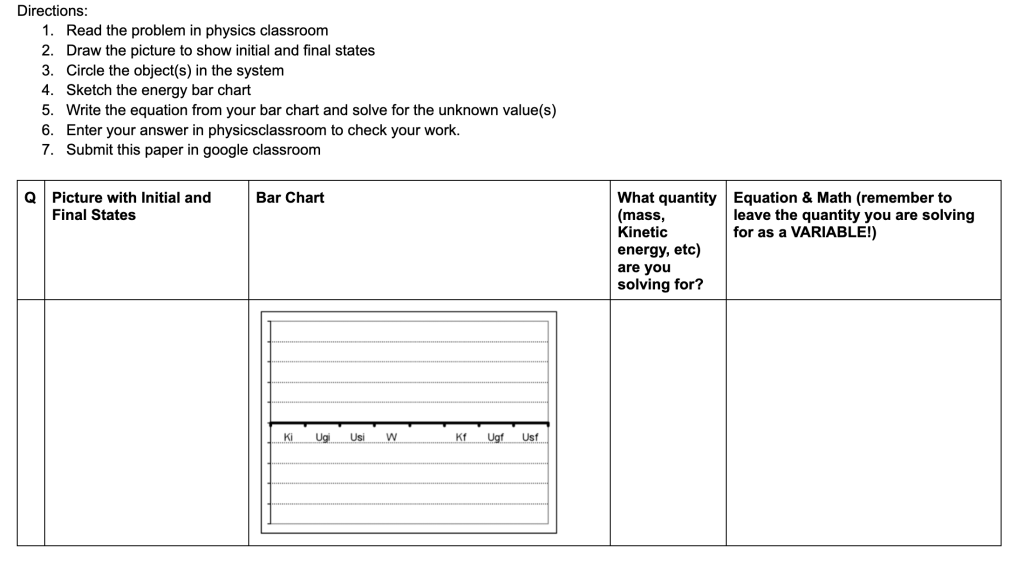
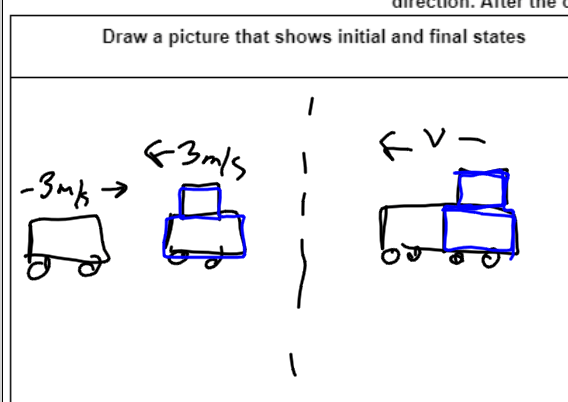
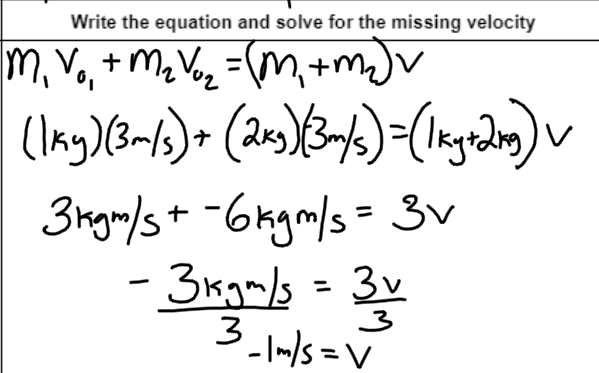
From here, students need additional opportunities to represent and reason, so I will use problems like the ones from TIPERS

Teachers that have learned about ISLE for the first time often feel overwhelmed by the idea of “changing everything” but in truth, it’s really more about shifting the overarching perspective and intention, and then you can continue to do a lot of the same activities you’ve done before! Consider any of the other misconceptions presented here, or that you can think of. What might be a way to develop an observational and testing experiement to support the undoing of their misconceptions?

Activities · Science of Learning

ABCs of How We Learn: G is for Generation

Generation is all about working that brain muscle. The more often we need to remember something, the more likely we are to remember it!

In the information processing model of cognition, this is the retrieval portion

Retrieval has a great deal of benefits when used correctly and there are a lot of misconceptions about retrieval.

First of all: you cannot retrieve what has not been encoded into long term memory. Why is this important? Because asking students to write down what they remember from today’s lesson as an exit ticket is not retrieval. That information is still in the maintenance rehearsal stage. What is rehearsal is asking them to write down two things they remember from yesterday’s lesson.

Retrieval isn’t just good for memories, it also raises student confidence and lowers testing anxiety! In my own classrooms as well as in the classrooms of colleagues, we’ve seen that when students engage in retrieval exercises often, student confidence in the classroom increases significantly. This is particularly true when you ask students to regularly engage in “brain dumps” where they write everything down they remember about a particular unit. As the unit progresses they should be able to write down more and more. It creates a visible piece of evidence of their learning with zero stakes attached to it.

Retrieval is probably something you already do, but to use it effectively we have to use it intentionally. I have two older blog posts about retrieval as a class activity and a study tool in my classroom with a few strategies. Personally, I always prefer to link up retrieval with some sort of additional strategy, whether its engaging students in discourse, having them compare and contrast or concept map.

Retrieval Might be the MOST important activity to support student assessments. Why? Because when students take an assessment they are asked to retrieve. However, if we are only ever pushing information during class, students rarely get the chance to practice that retrieval. Students should use retrieval to study, but they do not know or understand it typically, so we need to teach them (and their parents!) the benefits. If you’re saying “oh but I don’t lecture all hour, I have an active learning environment!” then I’m going to challenge you with this question: but do your students retrieve? Or are they only ever working in maintenance rehearsal? Relying on peers and notes to get to the answer?

My Favorite Use of Retrieval – Retrieve and Engage

Retrieval can be done as an act and of itself. However, while retrieval alone will enhance the memory pathways, it will not necessarily lead to a stronger application of that knowledge. In a science classroom we are constantly aiming for that higher order thinking: explain, create, evaluate. So we need to ensure that students are engaging in that thinking as often as possible.

The first way in which I enjoy using retrieval is by having students engage in a “brain dump”. Students write as much as they can about a given topic. To engage, students share their lists with classmates in small groups. We mix up the groups until eventually all students have the same information written on their papers. The 100% is in the room after all!

Another way in which I use retrieval is to ask students to complete a task identical to the previous day’s work, but then they pull out that work from their notes and evaluate themselves. The goal in this task, however, is for students to identify gaps. This task remains ungraded.

As I mentioned in a previous post, another way I like to use retrieval is to have students retrieve the content from the previous day, but then ask them to consider a similar, but slightly different case. In this instance students are first retrieving the example, and then are immediately asked to compare, contrast and then apply that knowledge to a new context. Below is an example activity that I used with AP Physics C students when going through simple harmonic motion derivations. We had already derived the simple and mass-spring pendula, so I asked students to retrieve those, then take a crack at the torsional and physical pendula.

Retrieval is not Endgame

While retrieval is an incredibly powerful tool that is easy to implement and we often forget to access, it is not endgame. It is simply one strategy amongst what should be an entire playbook. I see retrieval as a strong tool to motivate growth mindset and also as a strong tool to support teaching students how to properly study for the course and better identify their own gaps. However, especially in our science classrooms, it must continue to be paired with active learning cycles and opportunties for students to apply, create, do and evaluate.

Activities · Science of Learning

ABCs of How We Learn: F is for Feedback

“Ever tried. Ever failed. No matter. Try again. Fail again. Fail better”

I’ve seen these words by Samuel Beckett on posters and in classrooms. The intention is to support the idea of the classroom as a safe space to try and fail. But failure without actional feedback is just failure. The classroom environment that has high expectations and high support is also an environment with ample opportunities for feedback.

Feedback can come in a lot of degrees, from a minimal “correct/incorrect” to highly detailed narrative regarding the student choices. For most of our students, the feedback they require should fall somewhere between specific discrepancy and elaborative.

Unfortunately many students are used to only getting feedback after a summative assessment, and without retakes any feedback is usually worthless. (Consider the student who crumples the test and throws it away immediately).

In order for feedback to be effective, it needs to be specific, timely, understandable, nonthreatening and revisable. (For the Hattie/Visible Learning enthusiasts, the weighted mean effect size is 0.92)

Teacher Led Peer Evaluations

A few years ago I started requiring homework submissions as scans to google classroom by the start of the school day. This allows me to do a quick skim through student work and make decisions for class prior to seeing students. Below is a sequence of student work I wanted to review and discuss with students.

Responses are left anonymous, but I use them as a way to provide feedback via whole group discussion. In this sequence you can see the work going from pretty disorganized to much more logical and detailed. I can lead this discussion, or I can ask for student observations about the work.

Student Self-Evaluations

I’ve written before about using self-evaluations for student problem solving process. I haven’t crafted these rubrics for every unit, but I’ve found that for some students this helps them focus on the problem solving routine, rather than just the answer.

Google Form Check Ups

The check up is a follow up I use when students are engaging in practice that is not scored, checked or graded by me the teacher. You can see the full blog post on this process here. During the last 10-15 minutes of class I have students engage in several activities in the google form. The first is a self-evaluation of the learning objectives. Sometimes I will ask them to rate their work from the problem set using a rubric I provide. Last, I will put 1-2 items from the day’s practice and ask students to explain the answer. An example from this past week is below:

After students submit their answer and click next, the following pops up. It provides them with the answer and an explanation behind it.

For what it’s worth, I was VERY impressed by the number of students who got a similar problem to this one correct on their exams this past week! Students are reporting that circuits has been the easiest unit yet, but the reality is that there is a great deal of conceptual heavy lifting!

One of the most important features of all of these feedback forms is that they are happening during the learning process. This means that students can very quickly adjust their course of action in order to move towards the desired results.

Activities · Classroom Issues · In My Class Today

Teaching Students How to Score Better

At the American Association of Physics Teachers Winter Meeting I had the privilege of presenting in literally the best session of the entire conference (no bias here at all). Magically, all four of our presentations beautifully complimented one another and related deeply to engaging students in metacognitive skills.

I transitioned districts this year. In my previous district I worked with a lot of students in the gifted program, a lot of students in the creative and performing arts program (who are basically also gifted) and within this culture and climate, all kids benefitted, even the ones who were not in a special program. For years I was able to get students on board with the Expert Game, and the Science of Learning Physics some trust in the process, and good relationships. This year, that hasn’t quite cut it. I’d been thinking about a way to somehow “teach” students in a way that feel like “teaching” to them about how to learn, study and grow so they might buy into the idea (which is really nothing new).

I had been digging back into Powerful Teaching and some kind of workshop was begining to materialize, albeit very, very fuzzy. And then, at Winter Meeting, Aaron Titus gets up and shares that he offers a “How to Do Better on the Test” workshop which turns out to be “How to Learn”

The workshop is grounded in the work of Dr. Saundra McGuire. There are a lot of resources of hers around the web, like this lecture here on metacognition, but primarily she has a sweet little book called Teach Yourself How to Learn. It’s short, sweet, to the point and a lot of fun to read. Dr. McGuire is a retired chemistry professor and Director Emerita of the Center for Academic Success. She is also an awardee of the Presidential Award for Excellence in Math and Science Mentorship.

Immediately in chapter one she discusses one of the aspects about college that is hardest for students: getting As and Bs in high school often comes down to memorization and regurgitation. Now, before you come with fire I know that many of us (especially if we teach AP, and definitely if you enjoy my blog) are making students do incredible things. But I also know that you can probably name more than a handful of colleagues who don’t push their students beyond memorization. Teachers who produce study guides that are basically a carbon copy of the exam. Exams that are almost all multiple choice and the math is strictly plug and chug. The dreaded triangle to “support” students doing equations like F=ma. And if not the teachers themselves, some really great high school students simply don’t get pushed beyond needing to simply show up to class to learn the information. They can get away with minimal to no homework and no studying and still do okay in the class because we see them every single day and they work hard in our rooms.

So the workshop starts by introducing students to Bloom’s Taxonomy and we have a conversation about what level they are operating at most of the time, compared to what level they need to operate at for AP Physics. What level do they think they need to operate at in college?

And sure enough, if you pull up the science practices and skills for AP the word “create” is literally all over the place. The top of the pyramid.

From here we took a look at a recent exam question. First I asked them a simple question:

Which of the following is true about work?

  1. Work is effort
  2. Work is a change in energy
  3. Work is a force

They all know the answer. And this is a recall answer.

Then I showed them the exam question (they did really poorly on). While the question fundamentally was about the fact that work is a change in energy, what they were asked to do was apply the concept of taking an integral to calculate work and then create a graphical representation.

From here we discussed the differences between studying and learning and posed the question, “which would you work harder for? To study to get an A on a test, or prepare to teach the material to the class?”

The latter half of the workshop is about sharing strategies for doing homework, reading the text, and using practice exams. (You can find all of these in Dr. McGuire’s work and resources!)

I summarized some of these along with my personal favorites into the following list:

  • When you get home from school, write down everything you can remember from class that day, then compare with your class notes to identify/fill the gaps
  • Did you solve some problems? Grab a clean sheet of paper and solve the problem again. Compare to the example and make notes regarding your forgetting/gaps
  • Create a concept map to tie together big ideas and conceptual details
  • Make “teacher notes” as if you were preparing to teach the material
  • Aim for 100% mastery when you sit to study, not 85-90

As we wrapped up, the most important part of this workshop was asking students to make a commitment to do something different in the next 24 hours. I had students submit these along with some additional reflections. There were two that stood out to me today. One student reflected, “The reason this class is so challenging for me is because I haven’t had a class besides maybe Calc that required me to be at that creating level.”

A second student made an observation that knocked me over in joy:

“Physics is more than just who is smarter and has the ability to think at a higher level.”

And with that, I’m signing off. I’m going to attach my version of the slides, but everything is very much thanks to the work of Aaron Titus and Saundra McGuire.

Activities

Written Companions for Physics Classroom Practice

The Physics Classroom holds a place near and dear to my heart.

For years I thought it was my special secret. Long, long ago the url was something like physicsclassroom.glenbrook225.k12.il.us because it was a site hosted on my High School’s sever. The main author was Tom Henderson, one of the best educators at GBS. Tom taught the most advanced freshman in chem-phys, as well as the conceptual physics course. He had a great handle on meeting kids where they were at and explaining physics in a way that made sense as a student.

It wasn’t until much later I realzied that physics classroom was a well known resource for physics teachers across the nation.

As a student, something I realized was that what I found fun, challenging and helpful to my learning in physics was often a barrier and frustration to my classmates. Getting an “O Drats” without a way or opportunity to reflect or see where an error was made became maddening and frustrating. At the same time the essence of drilling a tiny skill is so valuable for long term learning.

I steered clear of most online homeworks for a long, long time (webassign also traumatized me). I knew that too often the real work that needed to happen to actually learn was skipped by most students in search of elusive green checks. By the time you got the checks, you had no memory of what actually worked.

Over the last few years I’ve started developing handouts to go along with some of the physics classroom activity sets. I only have a few, but enough that I feel like they are worth sharing publicly at this point. The goal is to get students thinking, writing and documenting as they work through the physics classrom activities. It also provides me with documentation. I will admit, another motivation for this was the fact that I did not have a paid subscription to task tracker. Now that I do, I’m developing more of these and will continue to share and post them here as I develop them.

What I’ve found is that more students are able to move through more problems with more success and confidence. Definitely a win! They hate me for slowing them down with the paper documentation, but I see it as a win.

Without further ado, here is the list:

Kinematics

Match That Graph Interactive

In the paper document (preview below) I ask students to first describe the motion in words. This way, when they watch the little car drive across the screen and make the dot diagram, they know what they are looking for

Kinematics Calculator Pad Sets

In the paper document, students are prompted to make their picture, their chart of variables and solve the problem by selecting an equation then substituting values as needed. This is a second version (sample below) that is specific to set 12, and provides more room for student work.

Momentum

Concept Checker: Case Studies Impulse and Force

The first few pages of this document are notes in which we construct the momentum bar charts for different situations and identify what is the same and different. Then students go to the concept checker and I ask them to create the bar charts and document the similarities/differences prior to making their selections. A preview is below and here is the handout

Work and Energy

This document can be used for the calcpad sets. I ask students to draw a picture, construct a bar chart, and solve the problem starting with conservation of energy. Preview below

Waves

Open Tube Concept Builder (can be used for closed tubes as well)

Document here, preview below

Concept Modeling · In My Class Today · Teaching Methods

Multiple Representations for Momentum Conservation

I did it. I finally revised how I teach momentum conservation to my on-track physics students and I’m never looking back!

It can be really hard to shift something that “works” especially if you don’t have a team. For my on-track physics students collision/explosion problems were always an “easy win” for students. We would define that “momentum is conserved” and then talk about how to solve the problems. I would lecture and show them the “table method” and then the “brute force method” and allow them to choose how they wanted to solve.

This was satisfying for students. It felt easy and students gained confidence in physics. However I was always irritated by this. They were performing a series of algorithms to get to an answer with no real understanding of the underlying ideas.

Sometimes we don’t make changes until we are forced to. I had yet to see this part of momentum done in a way that was in alignment with my overall pedagogy and it “worked” …enough. However this year during this particular set of lessons I was to be observed in my classroom. I wanted to ensure that the observation showed who I really am as a teacher, rather than a snapshot of something I had yet to address. So I started digging.

I had seen some work with momentum bar charts around the twitterverse and in Pivot Interactives and in the modeling community, but I wasn’t entirely sold on it. It felt like taking a good idea from energy and forcing it into a place it didn’t need to exist.

I looked to see what Kelly Oshea had done and found her momentum card sort, but I knew that would be too much for an introduction to the content, but it got me thinking.

The following set of four representations is what I settled upon, and here’s how it went:

First, for each of these I would demo the collision first so students had an idea of what was happening before and after the collision. We spend one day on elastic, one on inelastic and one on explosions and for each day we went through several different examples. I’m going to use our final inelastic case for this post.

1 – Draw a picture

There is a reason why “a picture is worth a thousand words”. A picture allows us to easily see and locate information that we might miss in text. For example, in this problem it becomes clear that we have some direction issues, so we know that negatives are going to come into play. For the purposes of my pictures I draw my more massive cars with the added mass on top. You’ll notice I’ve also color coded the larger car as blue.

2 – Momentum Bar Charts

I finally decided to implement the bar charts. For my intro problems I used whole numbers so that we could represent them with tangible “blocks” of momentum. The block width is the mass and the height is the velocity, so in this particular case the total number of blocks is the momentum. I found my students had a hard time shifting this to a more abstract view where you could use area so this will be an emphasis next time.

You’ll notice I’ve brought the color scheme over for the blocks. In class we have already discussed that the total momentum is constant. So we draw the initial case and then we discuss what the final case is going to look like in order to keep momentum constant. Students are able to recognize that we have a total of -3 units of momentum on the initial side, so we need 3 in the final. Since this is an inelastic collision the width has to be three which means the height can only be -1. Students are already solving collision problems without realizing they are doing math! This felt like a really cool win.

3 – Momentum vs time graphs

This part is something I need to think about a little more. It was something that was “obvious” to me, but was very much not obvious to students. To me, it was “obvious” because you just slap those initial and final values on the graph. The hard part, I thought, was ensuring that you are accounting for each car in the inelastic case.

I absolutely LOVE this representation because this is where students can SEE WHY momentum is constant. The CHANGE of each object is the same size, but different in direction! It’s super satisfying!

The challenges my students had came from notions about what it “should” do. Because the cars are moving together, they want the lines to go together at the end. When I recognized this, we spent a day looking at the representations as a whole and locating where momentum is represented in each in order to construct this graph of momentum. There were a lot of “ah ha” moments when we did this. I think next time I will save this graph for last.

4 – Mathematical Model

The tables are no more! With this mathematical model right next to the other representations, student can see where everything is coming from. The momentum terms, the momentum values, and the final velocity value at the end.

While this was definitely a harder task for students to complete, I feel a lot better about their conceptual understanding of what is happening in a collision. The multiple representations also mean that students have multiple ways of showing me that they understand what is happening.

Activities · Teaching Methods

How I Teach… Forces (Intro, the Observational Experiments)

The first set of posts I wrote for this series was about momentum because I made such a large shift from how I used to teach to how I currently teach.

In the same vein my teaching of forces has also changed.

In the past my force unit looked like this:

  1. Inertia Day! Lots of Demos, initiation into the inertia club with club cards (you hold the card on your index finger with a penny on top and figure out how to flick the card out from the penny)
  2. F=ma. Define it, notes, define force diagrams, practice force diagrams. Practice F=ma problems.
  3. One day on action-reaction. Gloss over it; “it’s easy”

I cringe writing this out now. It was so boring! Inertia and action-reaction felt like fluff. We don’t need fluff!

Currently, my unit structure is designed with the big ideas in mind. (Because, tenet 3: Order Matters, Language Matters) I was excited to see that the idea that teaching in a structure that models the thinking we are targetting to improve outcomes is actually supported by research, so my model draws on Lei Bao’s frameworks for force:

One of my biggest frustrations was students putting random “F(applied)” on force diagrams. It irked me to no end!

So starting with the framework for Newton’s Third Law, I turned my force unit on its head. The fundamental piece we begin with is:

A force is an interaction between objects

Observational Experiments

We start with the activity from Pivot Interactives where two cars collide.

Students are asked to separately write what they observe about the car motion and also what they observe about the force acting on each car.

After making the observations we discuss.

The primary aspect students recognize is that heavier/faster cars result in bigger forces. That’s all well annd good, but what about the force that each car experiences. Even though they’ve literally just witnessed and recorded it, they still want the heavier one to hit harder than the light one within the same collision! We closely observe this together and see that, indeed, the forces are always the same.

This is what allows us to define a force as an interaction between objects. Without a second object pushing on the ring, the ring won’t squish. Since the force is something that happens between, it must be equal and opposite.

This very small shift has been a game-changer. It is very rare for me to have students putting totally random forces on objects because “it should have one”.

From here we dive into Eugina Etkina’s ISLE cycle.

Students are asked to hold a heavy and a light object in each hand, palms up and then represent those objects with arrows on a diagram. Students are asked to label each arrow with the object interaction. This is a fun one because a lot of kids are quick to label “gravity” but when I inform them that gravity, is not in fact, an object, they have a moment of pause. Eventually all students arrive at the correct diagrams: equal sized forces on each object, bigger forces on the heavier object.

From here I diverge between AP and regular physics. In regular physics we will go directly to the mass vs weight lab where students will ultimately derive the expression F(earth) = mg. With AP we continue to follow a modeling cycle with experiments with a bowling ball down the hallway: rolling, constant force forward, constant force backward. Then I ask how we could have constant velocity AND constant force. Students are quick to say “push down” (and we are fresh off of projectiles where x and y are independent!). Then realize if we alternate “taps” that will do it (balanced forces). Students are asked to represent and reason by drawing a complete motion map, an accompanying force diagram and then look for patterns. In this way students then recognize that balanced forces will result in constant motion (including v=0) and unbalanced forces result in accelerations. For homework students will complete two exercises from the Active Learning Guide from Etkina’s book where they will continue to practice drawing motion maps and force diagrams together in order to find relevant patterns. From here we get ready for labs!

Up next… labs labs and more labs!
Quantitative Experiments with Forces

In My Class Today · Teaching Methods

Deliberate Practice with Mild, Medium & Spicy Problems

As a high school teacher homework is a constant battle.

At my high school it’s an equity issue. Many of my students lack the time, space and resources to complete homework.

But also, we also know that the fundamental differentiator between excellence and mediocracy is discipline and deliberate practice. And on a very fundamental level “use it or lose it”. So how to ensure practice and ensure it in a way where learning is happening for all students?

Enter Mild, Medium and Spicy questions.

I picked this idea up from Peter Liljidahl when he joined our nationwide physics book study in April on his book Building Thinking Classrooms in Mathematics. He’s been researching this type of practice most recently in classrooms and I was finally ready to give it a try.

I knew that my students needed some extra practice on calculating quantities from kinematic graphs. They just weren’t quite there yet. I could have assigned problems. If I did, I’d get a 25-50% completion rate and mostly students who did not need the practice provided.

Instead, I did the following:

1) I made a variety of position, velocity and acceleration vs time graphs. Mild graphs had one segment, medium had 2 and spicy had 3 or more. Then, I wrote out the solutions to all of the problems. I put the problems up with tape on 3 individual whiteboard for the three flavors. The answers were on a cabinet on the other side of the room

2) We reviewed the previous week’s quiz and identified that this was the area that needed work. I explained to students they could choose the problems, gave them a paper to document their work, and pointed out the answers were provided.

3) I kid you not, I had 100% of students working for 100% of the hour.. to the point where my last class of the day (who normally line up early) were shocked that the bell rang!

Why it works:

1)Taste vs Aptitude Instead of “levels” the questions are sorted by “flavor” there is something psychologically motivating about choosing your preference rather than feeling pigeonholed by ability.

2) Do What you need – give students a task with a number of items and they want to finish as quickly as possible. Alternatively, the task is overwhelming and they don’t even begin. A single graph at a time, that is student selected (hello autonomy!) is manageable. There’s no pressure! No pressure to complete a spicy, no pressure to complete x number of problems. Just do what you need. I had two students go for the spiciest spicy. I made a comment about it and they asked me if they did it correctly if they needed to do more. Ironically, because it was so complex they were going to end up doing 7 different problems in the process anyway!

3) Get to the deep stuff – honestly, the best part of this for me were the conversations I heard students having. Some of them would get into heated arguments about the correct answer, even though they could have just looked. But just looking was like skipping to the end of the movie. The puzzle was more important than the answer. (I’m going to remind folks real quick that this is NOT my AP course)

4) Student Wins – I heard several students comment that day “I feel smart in this class.” and I cannot tell you how big of a statement that is coming from this group of students. If you know, you know.

  • Have any of you tried anything like this?
  • How do you deal with the homework problem?
  • What are you thinking about regarding this idea?
Activities · In My Class Today

SciComm Unit Results

A few weeks ago I posted the article We Did Improv in Physics which outlined my four-day mini-unit emphasizing communication and presentation skills. Students did this in a number of ways including deconstructing TED talks, writing a blog post about their research, and giving a two minute impromptu version of their talk, in addition to the improv workshop. While the energy and the feelings in the room were fantastic, I also collected survey data from students that I’m going to share here.

Overall Results

Before we started the unit I asked students a number of questions around presentations. One of the prompts ask students to rate their confidence when presenting in front of peers from “Very Anxious” to “Very confident”. When the unit ended I asked them how they were feeling about presenting their physics projects. The results were astounding.

While the four day experience wasn’t quite enough to build substansial confidence (increase from 39 to 52%) the amount of anxiety significantly decreased from 42% of students reporting some level of anxiety to only 14%. About half of these students moved from anxious to neutral and the other half moved from anxious to confident.

Students were also asked to rate the statement “Being able to give presentations is an important skill for me to acquire” the number of students who marked “very important” doubled from pre to post assessment.

Students were also asked what the single, most important aspect of an excellent presentation was. While many of them stated “audience” there were also a great deal of other responses such as confidence but also things like structure, organization, and knowing your own material well

After the mini unit these responses were reduced to those that were emphasize from the lesson. An increase in the response “audience” was noted as well as an increase in mentions around the visuals. Noticeably less was “confidence”

Student Feedback On Activities

Students were prompted “Considering your final presentation, how valuable were the activities around dissecting the various talks?” Student rated on a 5 point scale from “not valuable at all” to “very valuable”. A summary of student responses for each of the three activities is below.

Turn Your Paper into a Blog Post

56% of students found the blogging activity to be useful, with only 8.7% of students reporting it was not. Some of the comments are below with scores in parenthesis:

  • It helped to see how there was a different type of communication between presentations and the lab report itself. (4)
  • It helped show us how to communicate our project in an understandable, engaging, and quick way. It used common language like our presentation will. (4)
  • I felt like the activity where you turned the report into the blog was helpful because it showed how you would convey your report to an audience rather than someone reading it just for information. (5)
  • By doing the blog post and using informal words I realized that this physics presentation was more like a conversation between our peers. We were just sharing our finding with one another and the blog post helped organize all this information. (4)

Interestingly, the students who rated the activity low still reported the value in the activity’s intention, demonstrating that the low score had more to do with their perceived needs than the intented learning.

It was somewhat helpful for making the presentation interesting and easy to understand. However, I didn’t find it helpful for actual content which I’m more concerned with. (2)

Data Viz Presentation & Evaluation

87% of students found the Data Viz presentation helpful. I think this is interesting because this was the one “lecture” that was provided and I know my students tend to prefer lectures. Still, there were some great reflections from students:

  • I did not realize how much detail is given into making slideshows. For example, I would have never thought about making slides colorblind proof. (4)
  • I especially liked this activity because it enabled us to visualize what we could change in our presentations through using new strategies. I especially found important how we learned to use less words and things on each slide, making them simpler. Also, the rule of thirds was a good guideline for how we laid out our slides. (5)
  • It helped to see the ways the data can be shown to not over power the audience with so much information at once. (5)
Improv Workshop

48% of students found the improv workshop to be helpful with only 8.7% reporting it was not helpful. There are a couple of pieces of evidence from the commentary that support these low numbers, even though there were drastic results observed in the pre- and post- presentations. Firstly, the intention of the activities was not clear to students until we debriefed. We did improv on a Friday and debriefed on Monday. Secondly, the workshop put students very far outside of their comfort zone.

Overall Impact

Overall students were very positive towards the mini unit. A few comments of note:

  • I think it was really valuable to have this unit because none of our other teachers really sit and go through what a generally good/well-rounded presentation should look like, they only focus on content/course specific presentations
  • It felt like a breath of fresh air, and made me realize that communication is a huge skill in in physics apart from problem-solving obviously.
  • I think that unit is helpful when it comes to sharing your findings with other people in an effective manner. I learned quite a bit about how to construct my slides to show only the important information. This unit is also helpful in feeling more comfortable presenting in front of your peers.

Students were also asked if I should run this lesson again. Every student except two said “yes”. The two exceptions marked “maybe”. Of note is that the two “maybes” expressed discomfort with the improv workshop, but had generally favorable commentary regarding the other activities.

Honestly, the results are beyond what I was hoping for. This is something I will absolutely continue.

Teaching Methods

Modeling vs Intentional Modeling

“I use modeling, do you?”
“Uh…no, but I’m interested in learning about it”

I felt like such a noob when I had this conversation a few months ago because literally, everyone else at my group seemed to be doing this already. I was at a workshop on whiteboarding after a talk on standards-based grading and modeling and I thought, “wow, she really has it together… I have a LOT of work to do” (Does anyone else have this overwhelming feeling of inadequacy in the classroom all. the. time. or is it just the mom-guilt extended into the classroom?)

So I have started incorporating some things here and there as I’ve gone along, and I recently looked into Etkina’s resources (I started using parts of her book last year). As I poured over Etkina’s labs and our workshop speaker’s resources I realized: I HAVE BEEN DOING MODELING ALL ALONG! Mostly because it’s just the way I already think about problems. It just didn’t have a fancy name, and more importantly, I wasn’t always doing it intentionally as a teaching strategy.

I’ve decided that the intention is really the key in modeling as a teaching strategy. I think good physicists are good at models but bad at teaching them. We do it so seamlessly in our own work we fail to realize that type of thinking is not seamless or natural to the general public.

Cue modeling curriculum

Models are just any representation we use for a situation: pictures, free body diagrams, motion diagrams, graphs, mathematics etc. We need to work our kids like gymnasts, very intentionally using and practicing these models so that our students become flexible and natural at using them on their own for any scenario.

This is the paradigm shift: teach the model first, and the physics as a result of the model. Too often physics teachers (especially physics teachers not trained in physics) teach all this physics stuff, then all these equations for particular problems and then maybe shove in some graphs at the end. The problem is that students fail to see the bigger picture and physics becomes a class where students are attempting to memorize a million procedure for a million different problems, rather than learning a handful of approaches and selecting the best one or two for the problem at hand. The clearest example of this in my current classroom is how I am teaching two-body problems. I have made a huge deal about the fact that all of the physics is in the FBD. Because learning the general process for FBDs is a lot easier than trying to memorize separate processes for ramps, Atwood machines, modified atwood’s and oops! Now there’s friction!

The next most important part of this is to teach students how to communicate with one another using their models, and this is where the value of whiteboarding comes into play. I believe very strongly in letting the kids move around the room to see whiteboards without having a board representative at each board. The reason for this is that the students begin to realize that it’s hard to make sense of what someone has done if you don’t provide enough detail. Students can then ask these questions and leave them at the board before we come together as a whole group for discussion.

I decided to use modeling very intentionally in the classic coffee-filter air resistance lab. The original lab I had snagged from someone had a bunch of background info and then asked students to skets the velocity and acceleration graphs. I got really tired of marking the same things on everyone’s papers last year and realized this year that this is a perfect opportunity for modeling.

When students walked in today their desks were in groups of four with a whiteboard. I asked them for the following

  1. A free body diagram at t=0, sometime before terminal velocity, and at terminal velocity
  2. Acceleration expressions for each of the diagrams
  3. position, velocity and acceleration vs time graphs.

IMG_1632
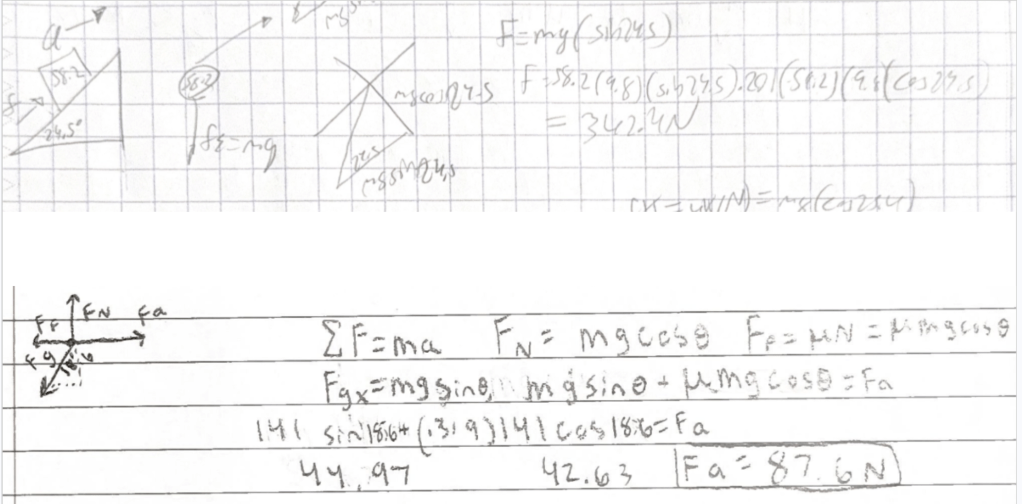
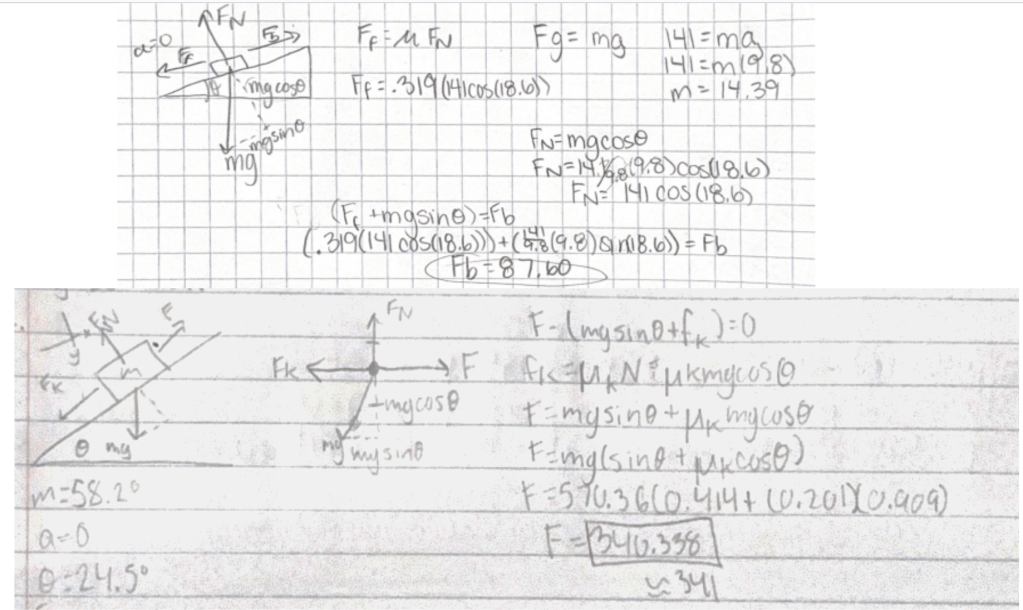
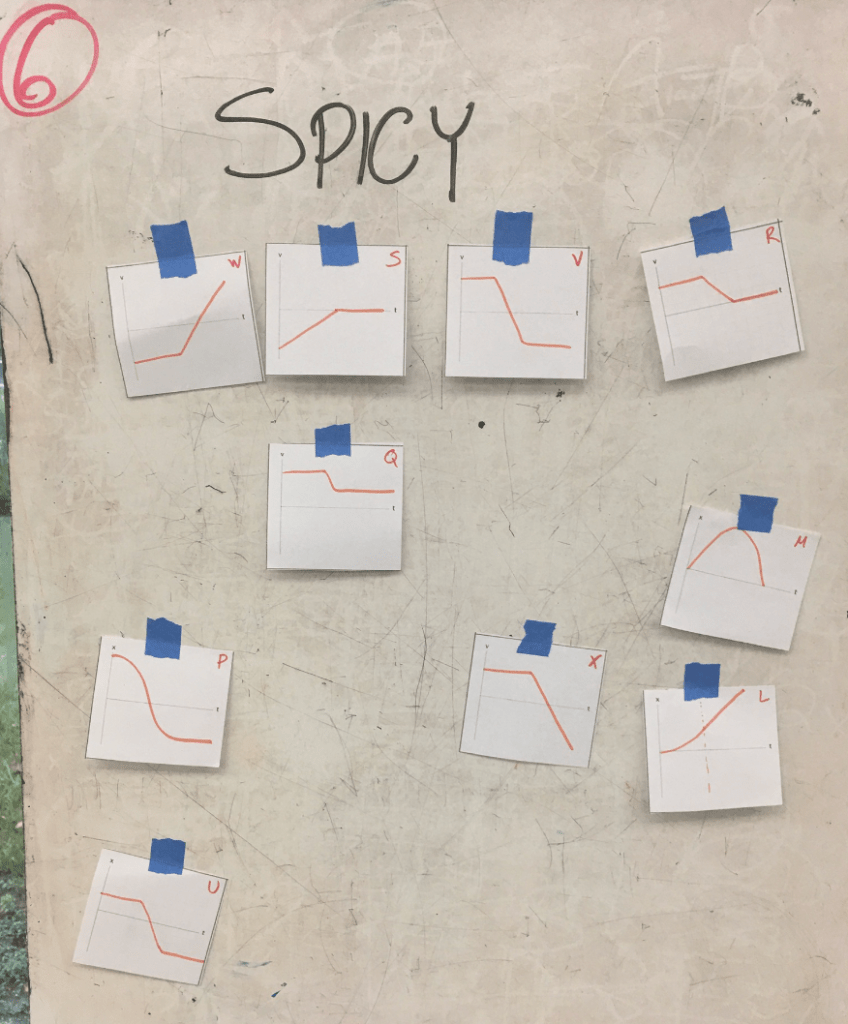
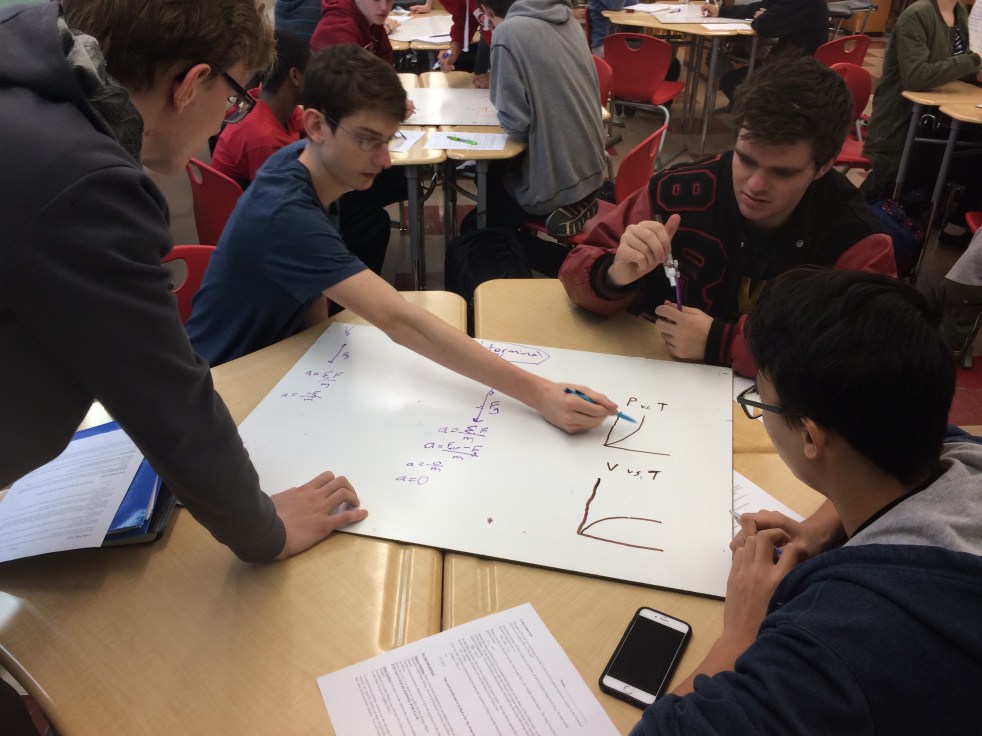
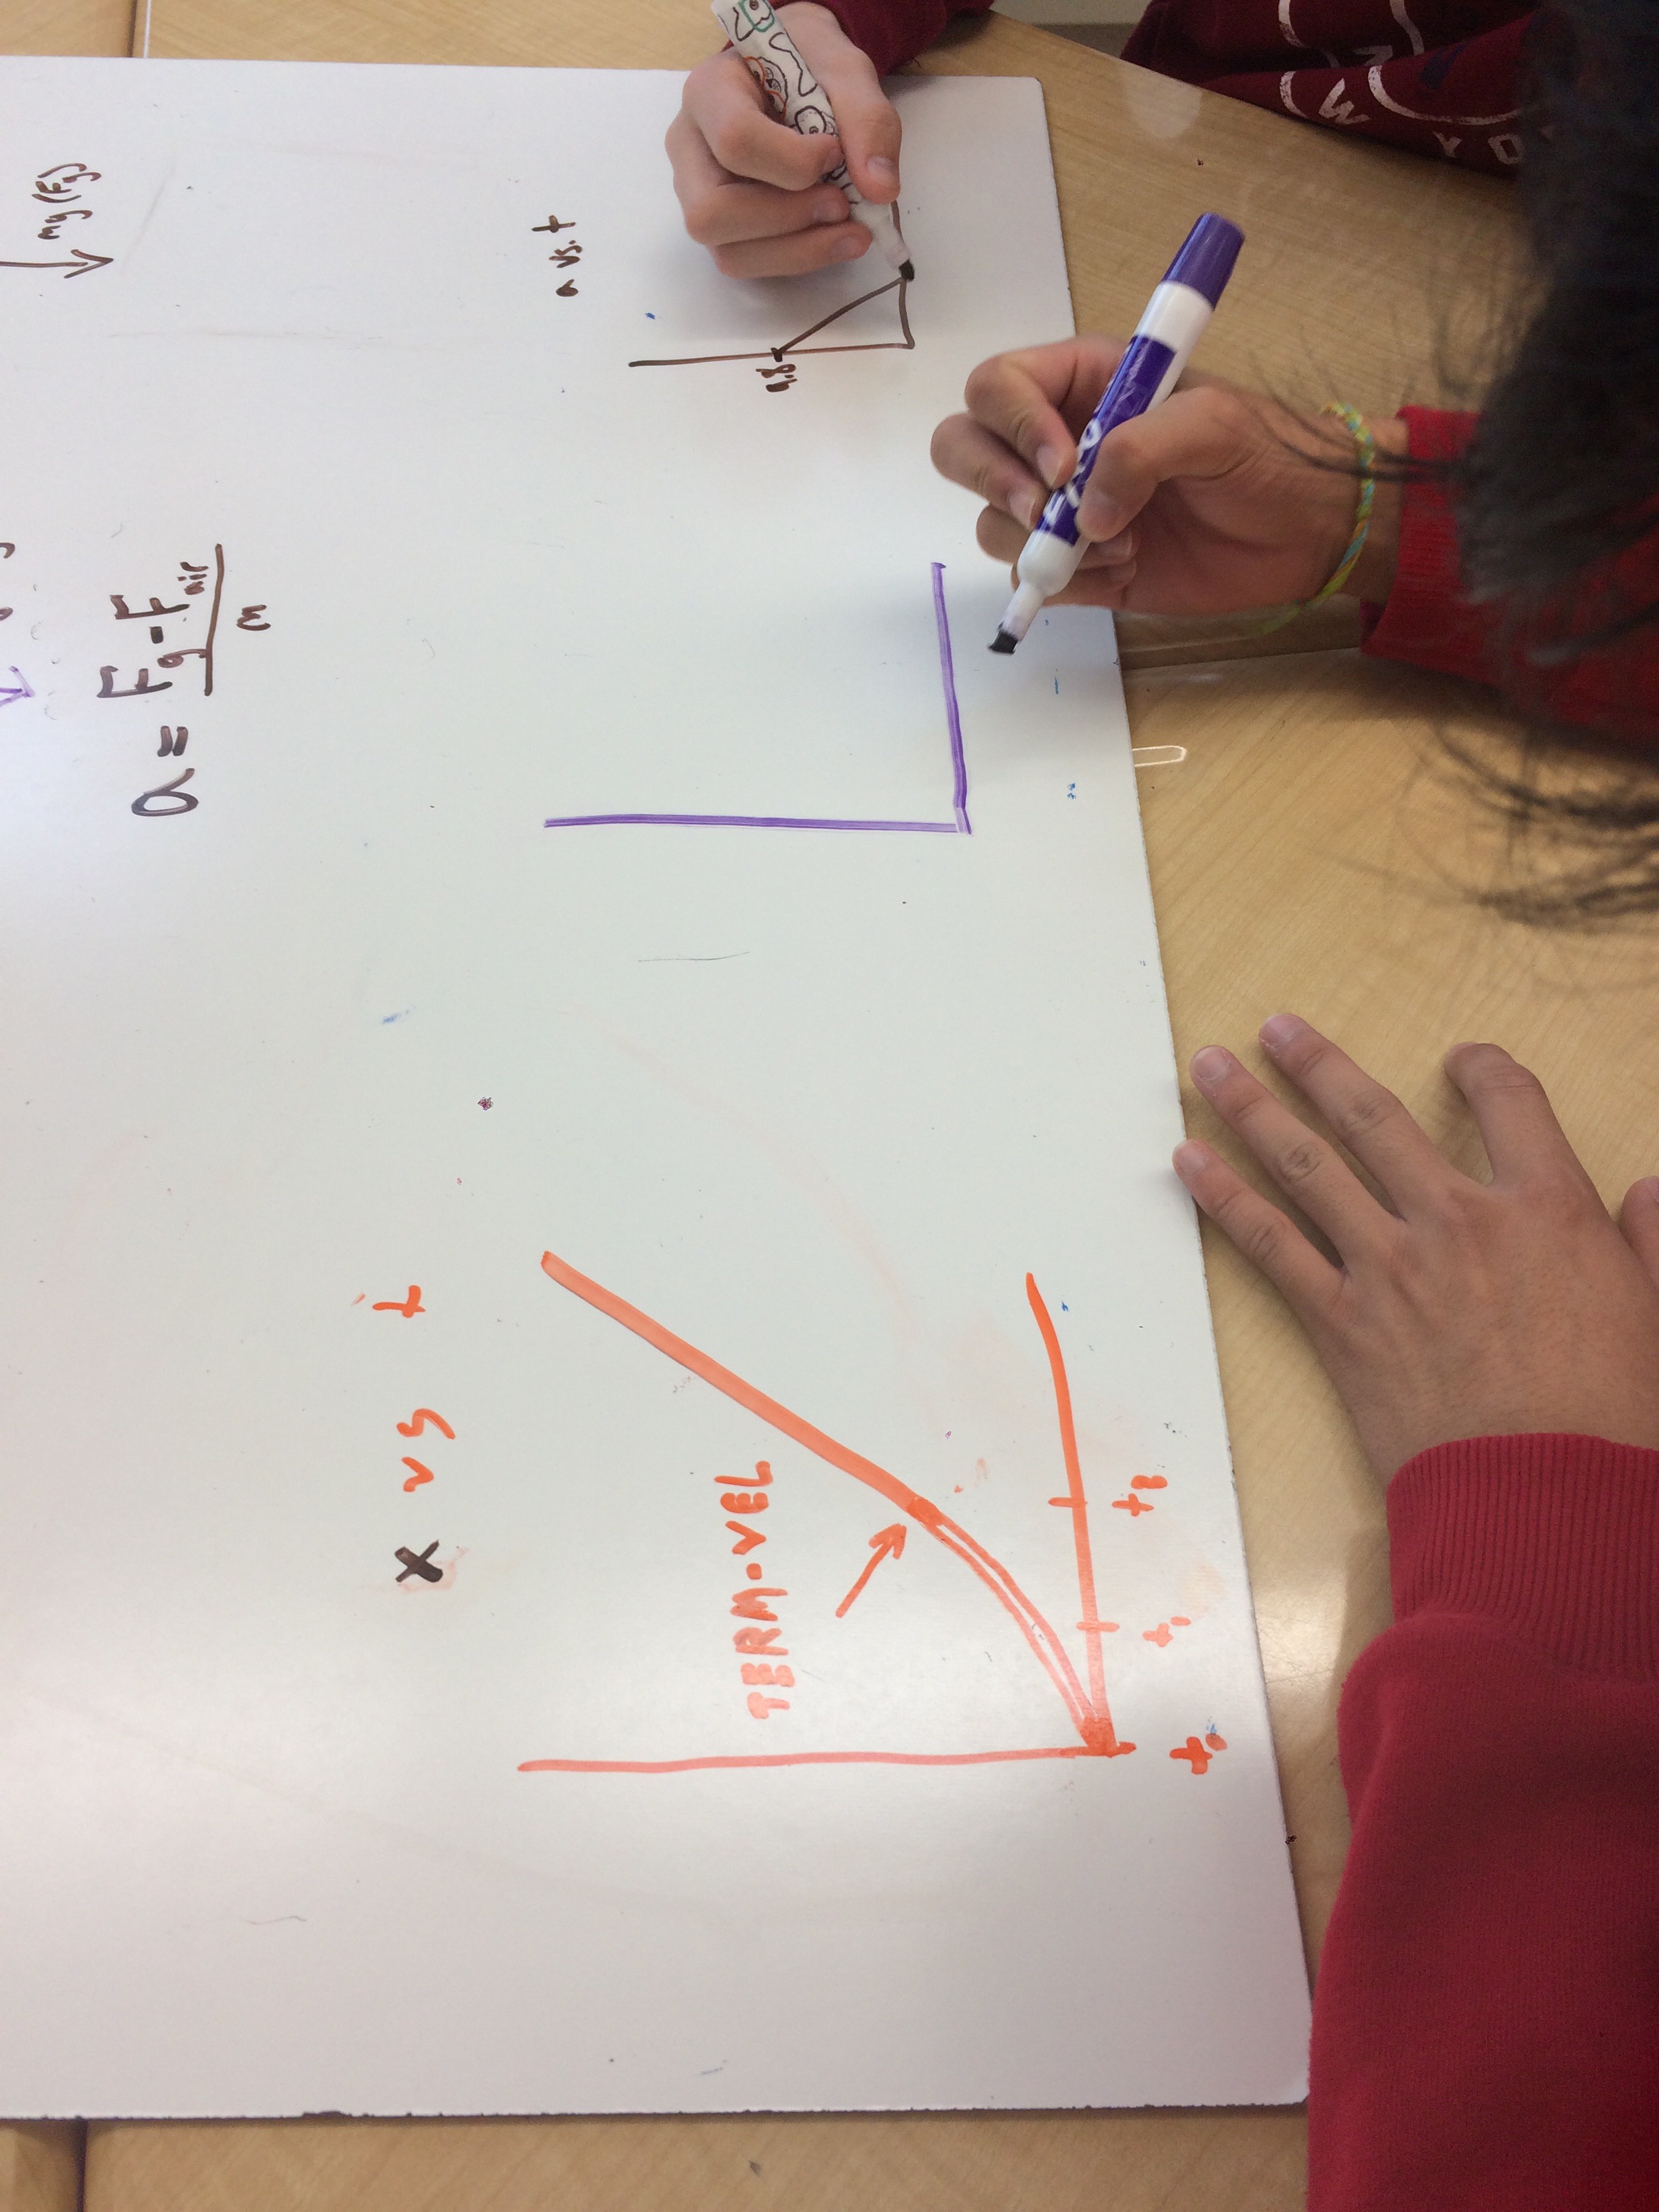
It was so cool to watch them work, discuss and argue. The FBD’s were relatively easy, the discussions mostly about whether or not to put air resistance on the t=0 diagram.

The discussions about the graphs were far more interesting. Many students were working with the graphs as unique units, rather than considering the relationships from one to the next. Inevitably we had piecewise acceleration graphs and linear acceleration graphs and linear piece-wise vs curved velocity graphs.

IMG_1633


I asked the kids to cite similarities and ask questions about differences. One group today started changing their board before attention was drawn to them. It offered a fantastic opportunity to review the graph models and review the relationships.

One of my favorites was a group that decided the curve of the velocity graph was quadratic, so they started taking the antiderivative for the position function. They noticed the constant slope portion in many of the other graphs and asked the question about it. Then they realized (#overachievers) the velocity graph wasn’t really quadratic.

I realize this particular example isn’t quite model-based learning through and through as I did not allow them to experimentally discover the exponential function relationships, rather after discussing that all of these changes were continuous I gave them a brief taste of the calculus/diff eqs ending in “solution is always in the form….” and hey, doesn’t that look like the curve we agreed upon?

We only collected data today, so I’m really curious and excited for what their write-ups are going to look like Wednesday!

I’ll keep you posted 🙂