Teaching Methods

Radical Renovations: The iOLab

I visited my alma mater today. The entirety of Green Street on campus is closed to traffic due to all of the construction. Buildings have gone down and come up and I half expected time to still be frozen in the year 1967 in the physics building.

When I walked in I found quite the opposite. Not only newly renovated rooms, but there is actually a women’s bathroom on the fourth floor. (This was always a running joke)

The reason I spent 6 hours in my car today, however, was to visit the Physics 101 class. iolab_remotes_redMy former adviser, Mats Selen, has been working on a new project: the iOLab. The concept is simple, it’s a multisensor system in a box. And it can do everything your $10,000 of Vernier equipment can do… for a little over $100. It connects wirelessly to your computer and runs with free, opensource software that does all of the analysis our expensive programs run.

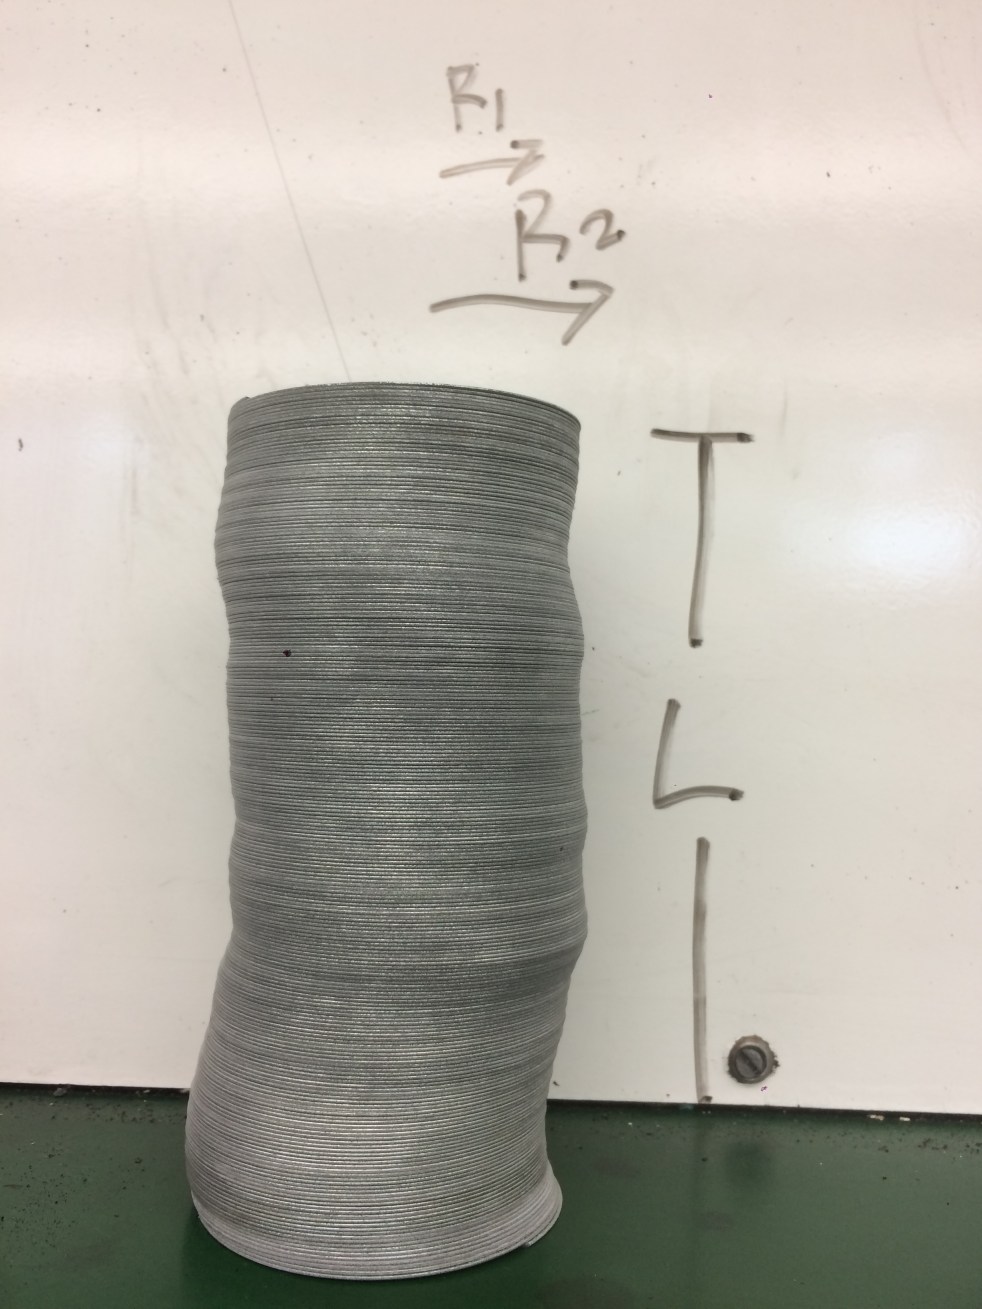
On the other side of the coin, however, is a radical change in how the introductory level classes are being taught. When students walked into the lab, they had done a pre-lab experiment earlier…..at home…..with their iOLabs. Quite simply, they made a stack of books, put another book on top by its edge and then looked to see how the force changed with the iOLab as it was placed at different distances from the book stack. Data were submitted ahead of time for credit. Students discussed the results at the beginning of the lab and then were given their task. It’s the classic peg-board demo, however, students had to find a way to relate the force to the placement of the probe if the pivot was located in the top corner.

This was the sum total of the direction given to students.

Within about 20 minutes all students were taking measurements. Some were looking only horizontally, others were looking both horizontally and vertically. Questions arose about the approach: if we change the angle at which we hold the probe the force will change. Are we supposed to do this with a horiztontal force too? I think that’s impossible.

They were told it’d be great if they came up with a mathematical relationship, but they’re just looking for the trends.

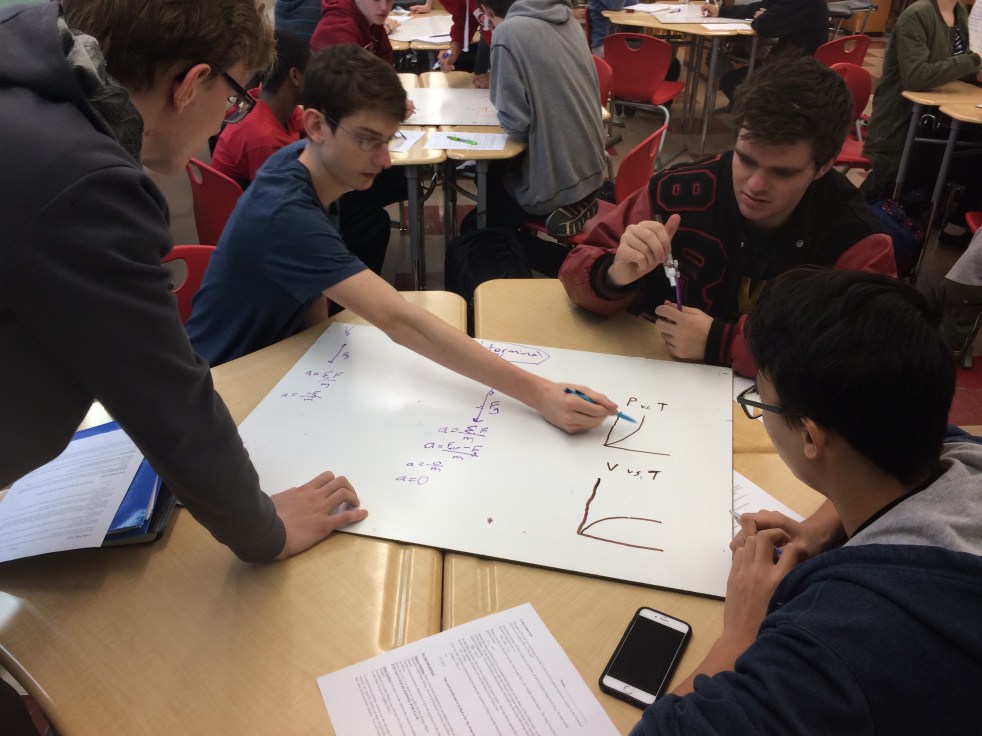
Within an hour students were plotting their data, recognizing it was an inverse relationship and running the curve.

One group really wanted to get the formula.

Another group recognized the torques should be equal and started calculating all of the torques. Percent uncertainty was one of the objectives focused on, so I wanted to see how well they were grasping that concept. I looked at the torques and noticed the values were .14, .14, .14, .15, .16. So I asked them how they were going to decide that those were constant and not increasing. They responded that they would have to determine their percent uncertainty and compare what was acceptable to those values.

Now, clearly there are major differences between high school junior and seniors and pre-med juniors and seniors, but at the same time, it was still remarkable how they were approaching the lab, developing their experiment and writing up their labs. It is something that very much excites me about the potential use in the high school classroom (and online classrooms, and college classrooms etc)

I also asked students about their previous physics experiences. About half reported they had taken physics in high school, ranging from regular level to AP Physics 1. ALL students reported that they felt they had a FAR BETTER grasp of physics now in this course, compared to their high school course. Several students who said this felt the need to insist they still had a great high school teacher 🙂

The message, however, is clear: we need to give our students the opportunity to design and evaluate their experiments.

Also, the iOLab is a very exciting new piece of equipment. Morten Lundsgaard, currently the Coordinator of Physics Teacher Development
Instructor, is hoping to run workshops and/or a camp for high school teachers. If you are interested you should contact him!

Concept Modeling · Teaching Methods

Slicing a Cylinder for Moment of Inertia Integration

Guys….we’re in the throws of rotation. And at least one of my poor students has calculus immediately preceding AP Physics C. I feel so bad for her. The day we started she had made up a calc quiz, came to day 1 of rotational inertia, then went to calculus. Oh did I feel her pain.

Arguably the most difficult part of deriving rotational inertia is the visualization of how to go about the integration. I mean, let’s be honest, once we find how to express dm the integration is always an easy one.

Part of the problem is getting students to understand what it means to say things like dm, dV, dA, etc. They understand the definition linguistically, but it’s really hard to think of it practically. Tell them that dr^2 is zero and their minds are blown and bothered.

Day 1 of cylinders did not go well. Arguably, in part, because we were short on time. But also because the what why how was overwhelming.

I remembered a demo someone had shown where they 3D printed their objects to roll down the incline. They had actually made nesting cylinders, which then served as a great way to discuss integration.

I’m trying to think of a way to visualize each of the d-steps of the cylinder integration for my students with materials I have on hand. As I’m digging through the closet I notice the slinky coil. It’s nearly perfect!!!

Ideally, I wish I had one with nice thick coils so we could take about the cylinder with R1 and R2, but this will suffice for the most challenging part.

So imagine you have a cylinder of length L, and inner radius R1 and outer radius R2 and would like to determine the moment of inertia about its center…

IMG-2037 (1)

First, as always let’s define rho, but we have to find dm in terms of r. So how do we do that?

Well, let’s take some horizontal slices, where each slice is dm… now we can see that dm = rho*dV…but wait… what is dV?

Well, if we make those slices infinitely small…is there really a volume left?

IMG-2040

Ah! so dV is really dA, and we are looking at it across the length of the slinky, so dm = dA*L!

Conveniently, I know that A=pi*r^2, so dA = 2*pi*r dr

And the rest is substitution!

Teaching Methods

Modeling vs Intentional Modeling

“I use modeling, do you?”
“Uh…no, but I’m interested in learning about it”

I felt like such a noob when I had this conversation a few months ago because literally, everyone else at my group seemed to be doing this already. I was at a workshop on whiteboarding after a talk on standards-based grading and modeling and I thought, “wow, she really has it together… I have a LOT of work to do” (Does anyone else have this overwhelming feeling of inadequacy in the classroom all. the. time. or is it just the mom-guilt extended into the classroom?)

So I have started incorporating some things here and there as I’ve gone along, and I recently looked into Etkina’s resources (I started using parts of her book last year). As I poured over Etkina’s labs and our workshop speaker’s resources I realized: I HAVE BEEN DOING MODELING ALL ALONG! Mostly because it’s just the way I already think about problems. It just didn’t have a fancy name, and more importantly, I wasn’t always doing it intentionally as a teaching strategy.

I’ve decided that the intention is really the key in modeling as a teaching strategy. I think good physicists are good at models but bad at teaching them. We do it so seamlessly in our own work we fail to realize that type of thinking is not seamless or natural to the general public.

Cue modeling curriculum

Models are just any representation we use for a situation: pictures, free body diagrams, motion diagrams, graphs, mathematics etc. We need to work our kids like gymnasts, very intentionally using and practicing these models so that our students become flexible and natural at using them on their own for any scenario.

This is the paradigm shift: teach the model first, and the physics as a result of the model. Too often physics teachers (especially physics teachers not trained in physics) teach all this physics stuff, then all these equations for particular problems and then maybe shove in some graphs at the end. The problem is that students fail to see the bigger picture and physics becomes a class where students are attempting to memorize a million procedure for a million different problems, rather than learning a handful of approaches and selecting the best one or two for the problem at hand. The clearest example of this in my current classroom is how I am teaching two-body problems. I have made a huge deal about the fact that all of the physics is in the FBD. Because learning the general process for FBDs is a lot easier than trying to memorize separate processes for ramps, Atwood machines, modified atwood’s and oops! Now there’s friction!

The next most important part of this is to teach students how to communicate with one another using their models, and this is where the value of whiteboarding comes into play. I believe very strongly in letting the kids move around the room to see whiteboards without having a board representative at each board. The reason for this is that the students begin to realize that it’s hard to make sense of what someone has done if you don’t provide enough detail. Students can then ask these questions and leave them at the board before we come together as a whole group for discussion.

I decided to use modeling very intentionally in the classic coffee-filter air resistance lab. The original lab I had snagged from someone had a bunch of background info and then asked students to skets the velocity and acceleration graphs. I got really tired of marking the same things on everyone’s papers last year and realized this year that this is a perfect opportunity for modeling.

When students walked in today their desks were in groups of four with a whiteboard. I asked them for the following

  1. A free body diagram at t=0, sometime before terminal velocity, and at terminal velocity
  2. Acceleration expressions for each of the diagrams
  3. position, velocity and acceleration vs time graphs.

IMG_1632It was so cool to watch them work, discuss and argue. The FBD’s were relatively easy, the discussions mostly about whether or not to put air resistance on the t=0 diagram.

The discussions about the graphs were far more interesting. Many students were working with the graphs as unique units, rather than considering the relationships from one to the next. Inevitably we had piecewise acceleration graphs and linear acceleration graphs and linear piece-wise vs curved velocity graphs.

IMG_1633


I asked the kids to cite similarities and ask questions about differences. One group today started changing their board before attention was drawn to them. It offered a fantastic opportunity to review the graph models and review the relationships.

One of my favorites was a group that decided the curve of the velocity graph was quadratic, so they started taking the antiderivative for the position function. They noticed the constant slope portion in many of the other graphs and asked the question about it. Then they realized (#overachievers) the velocity graph wasn’t really quadratic.

I realize this particular example isn’t quite model-based learning through and through as I did not allow them to experimentally discover the exponential function relationships, rather after discussing that all of these changes were continuous I gave them a brief taste of the calculus/diff eqs ending in “solution is always in the form….” and hey, doesn’t that look like the curve we agreed upon?

We only collected data today, so I’m really curious and excited for what their write-ups are going to look like Wednesday!

I’ll keep you posted 🙂