The Physics Classroom holds a place near and dear to my heart.
For years I thought it was my special secret. Long, long ago the url was something like physicsclassroom.glenbrook225.k12.il.us because it was a site hosted on my High School’s sever. The main author was Tom Henderson, one of the best educators at GBS. Tom taught the most advanced freshman in chem-phys, as well as the conceptual physics course. He had a great handle on meeting kids where they were at and explaining physics in a way that made sense as a student.
It wasn’t until much later I realzied that physics classroom was a well known resource for physics teachers across the nation.
As a student, something I realized was that what I found fun, challenging and helpful to my learning in physics was often a barrier and frustration to my classmates. Getting an “O Drats” without a way or opportunity to reflect or see where an error was made became maddening and frustrating. At the same time the essence of drilling a tiny skill is so valuable for long term learning.
I steered clear of most online homeworks for a long, long time (webassign also traumatized me). I knew that too often the real work that needed to happen to actually learn was skipped by most students in search of elusive green checks. By the time you got the checks, you had no memory of what actually worked.
Over the last few years I’ve started developing handouts to go along with some of the physics classroom activity sets. I only have a few, but enough that I feel like they are worth sharing publicly at this point. The goal is to get students thinking, writing and documenting as they work through the physics classrom activities. It also provides me with documentation. I will admit, another motivation for this was the fact that I did not have a paid subscription to task tracker. Now that I do, I’m developing more of these and will continue to share and post them here as I develop them.
What I’ve found is that more students are able to move through more problems with more success and confidence. Definitely a win! They hate me for slowing them down with the paper documentation, but I see it as a win.
Without further ado, here is the list:
Kinematics
Purchase my kinematics pack here
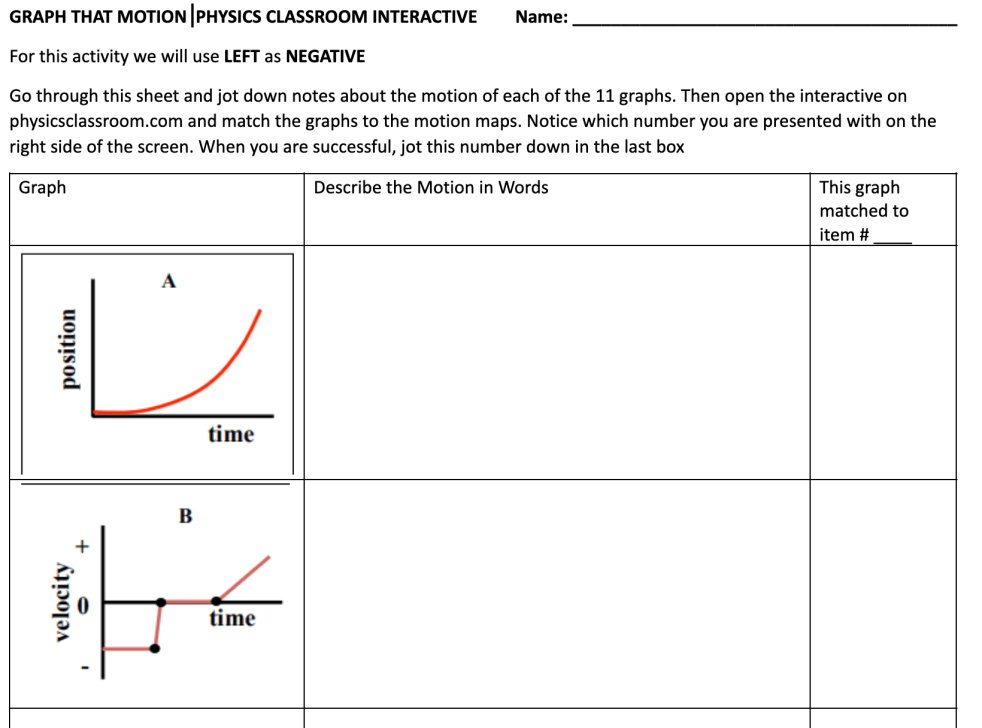
I ask students to first describe the motion in words. This way, when they watch the little car drive across the screen and make the dot diagram, they know what they are looking for

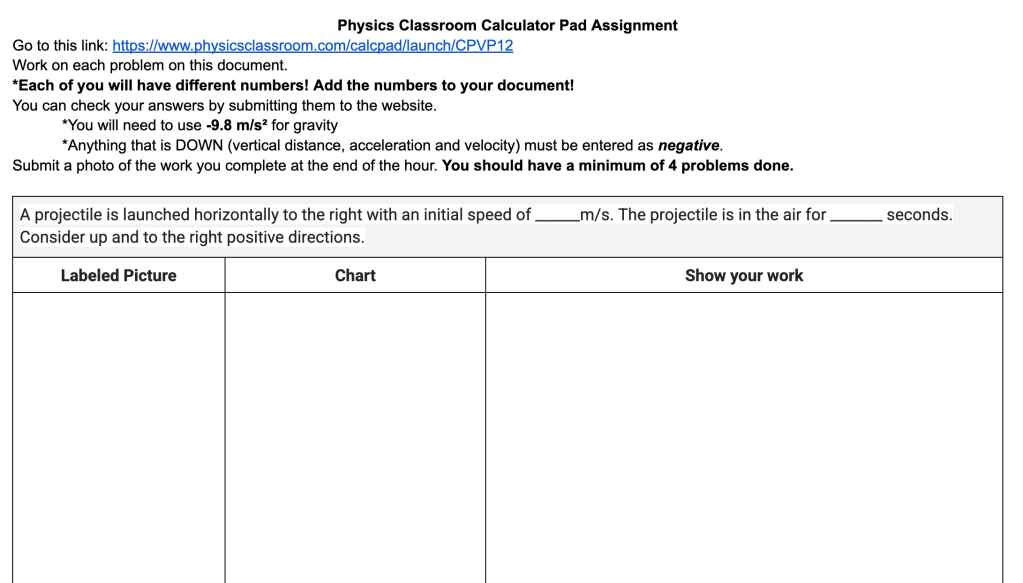
Kinematics Calculator Pad Sets
In the paper document, students are prompted to make their picture, their chart of variables and solve the problem by selecting an equation then substituting values as needed. This is a second version (sample below) that is specific to set 12, and provides more room for student work.
Momentum
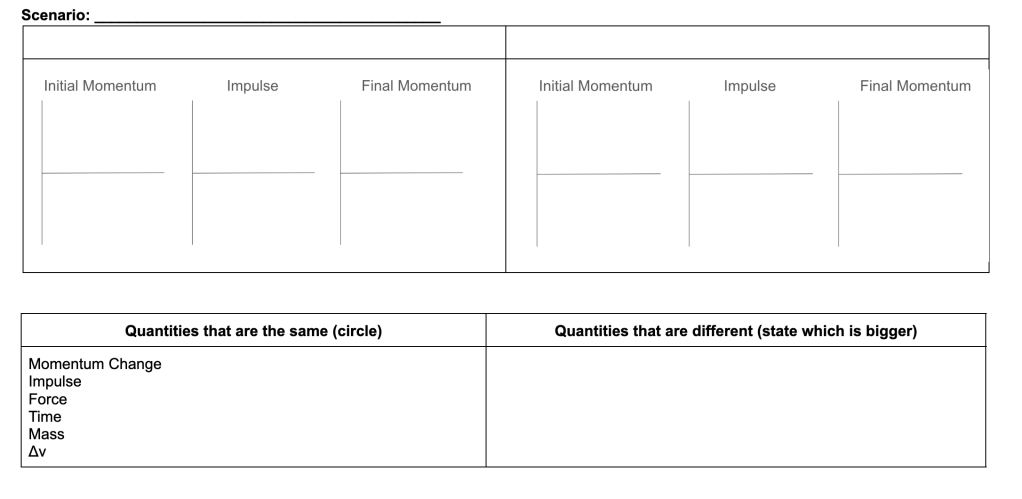
Concept Checker: Case Studies Impulse and Force
The first few pages of this document are notes in which we construct the momentum bar charts for different situations and identify what is the same and different. Then students go to the concept checker and I ask them to create the bar charts and document the similarities/differences prior to making their selections. A preview is below and here is the handout
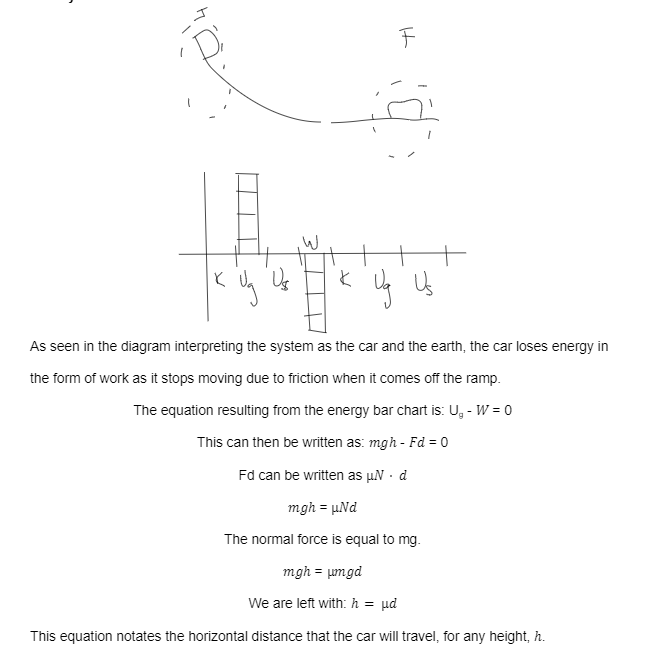
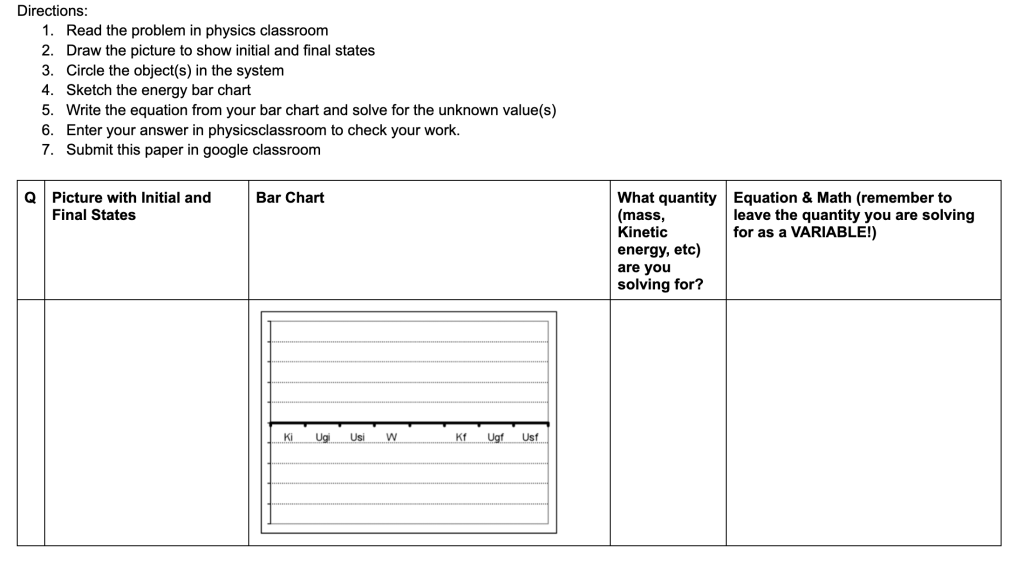
Work and Energy
This document can be used for the calcpad sets. I ask students to draw a picture, construct a bar chart, and solve the problem starting with conservation of energy. Preview below
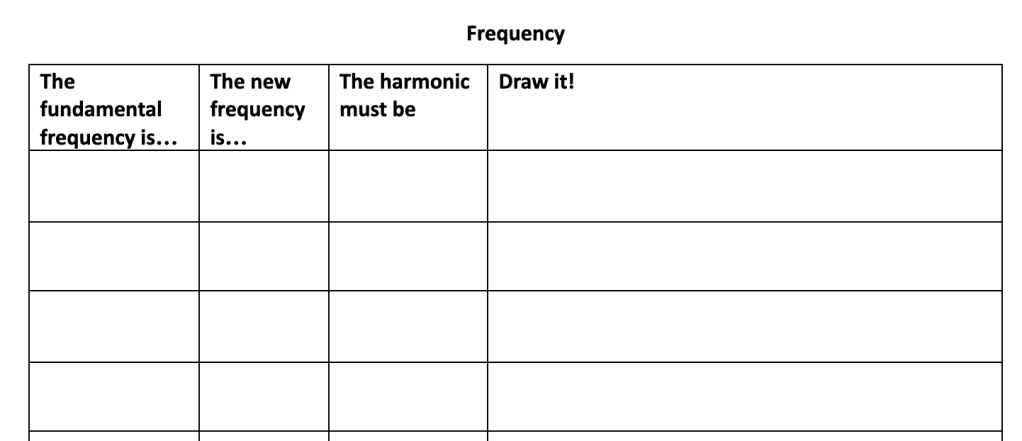
Waves
Open Tube Concept Builder (can be used for closed tubes as well)
Document here, preview below