In my last post I talked about how I finally reenvisioned collisions and explosion problem solving for my on-track physics. It went so well I’m definitely going to integrate more of it into AP.
The goal of the reenvisioning was to set students up for a meaningful tennis ball cannon launch lab at the end of the lesson sequence.
If you’re unfamiliar, you create a tennis ball cannon, launch it, and have students calculate some quantity based on momentum conservation. To be honest, I haven’t run this lab since my first few years teaching for a few reasons. One was that my cannon got stolen at my first job. Then I decided that whole class labs are less effective than small group work and I hate when it looks like everyone is copying answers. The activity just wasn’t meaningful enough.
But after talking to several friends, everyone was excited about the idea of a cannon launch, so I spent my weekend rebuilding a cannon.
To open the lesson I set up and demonstrated an “explosion” with our car-track system. I ensured that one car had more mass than the other and we had some conversations about what to expect. We also talked about what the equation would look like based on our previous experiences with elastic and inelastic collisions. Students were able to correctly determine that it’s basically the opposite of an inelastic collision.
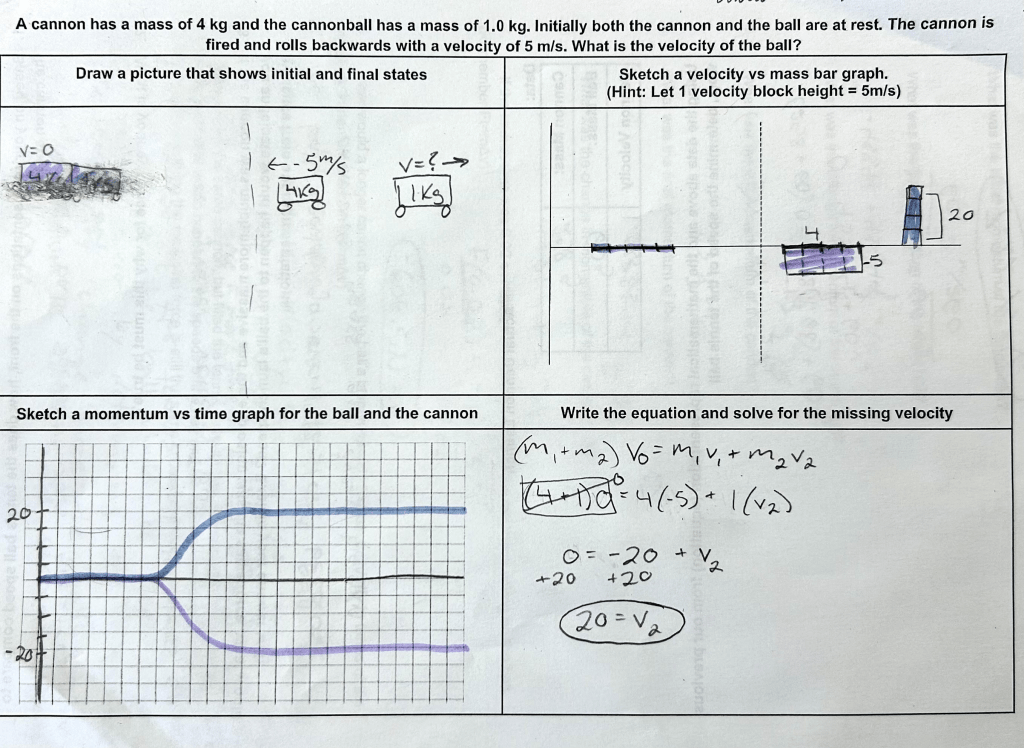
Next, I gave them the scenario where the cannon had a mass of 4.0 kg, the ball had a mass of 1.0 kg and the cannon’s launch velocity was 5 m/s. These numbers were strategically chosen. I wanted to keep whole numbers and also have a cannon-ball ratio that was similar to the actual cannon-tennis ball.
Students then completed the four representations as we’d previously done earlier in the week. Below is a student work sample.
The great thing about this was that students were able to accurately represent and predict the outcomes of the cannon-ball system before we got into the muck. This got students thinking individually and talking in small groups. We also discussed why the results made sense.
To launch the cannon I let it go through a photogate to snag the post explosion velocity and then students completed the calculations.
For the post-lab analysis I threw in a few thinkers. They included:
Find the average force on the ball
How would a longer cannon change the ball’s launch speed? Explain in terms of impulse-momentum
If we used the same cannon but filled the tennis ball with rice, what would happen to the speeds of the ball and cannon post explosion?
You can see a sample student response below:
These questions led to some really great conversations that brought us back to equal forces, equal momentum changes and where time falls into the mix.
I did it. I finally revised how I teach momentum conservation to my on-track physics students and I’m never looking back!
It can be really hard to shift something that “works” especially if you don’t have a team. For my on-track physics students collision/explosion problems were always an “easy win” for students. We would define that “momentum is conserved” and then talk about how to solve the problems. I would lecture and show them the “table method” and then the “brute force method” and allow them to choose how they wanted to solve.
This was satisfying for students. It felt easy and students gained confidence in physics. However I was always irritated by this. They were performing a series of algorithms to get to an answer with no real understanding of the underlying ideas.
Sometimes we don’t make changes until we are forced to. I had yet to see this part of momentum done in a way that was in alignment with my overall pedagogy and it “worked” …enough. However this year during this particular set of lessons I was to be observed in my classroom. I wanted to ensure that the observation showed who I really am as a teacher, rather than a snapshot of something I had yet to address. So I started digging.
I had seen some work with momentum bar charts around the twitterverse and in Pivot Interactives and in the modeling community, but I wasn’t entirely sold on it. It felt like taking a good idea from energy and forcing it into a place it didn’t need to exist.
I looked to see what Kelly Oshea had done and found her momentum card sort, but I knew that would be too much for an introduction to the content, but it got me thinking.
The following set of four representations is what I settled upon, and here’s how it went:
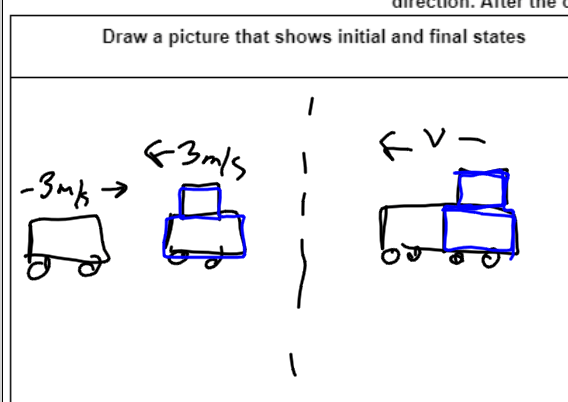
First, for each of these I would demo the collision first so students had an idea of what was happening before and after the collision. We spend one day on elastic, one on inelastic and one on explosions and for each day we went through several different examples. I’m going to use our final inelastic case for this post.
1 – Draw a picture
There is a reason why “a picture is worth a thousand words”. A picture allows us to easily see and locate information that we might miss in text. For example, in this problem it becomes clear that we have some direction issues, so we know that negatives are going to come into play. For the purposes of my pictures I draw my more massive cars with the added mass on top. You’ll notice I’ve also color coded the larger car as blue.
2 – Momentum Bar Charts
I finally decided to implement the bar charts. For my intro problems I used whole numbers so that we could represent them with tangible “blocks” of momentum. The block width is the mass and the height is the velocity, so in this particular case the total number of blocks is the momentum. I found my students had a hard time shifting this to a more abstract view where you could use area so this will be an emphasis next time.
You’ll notice I’ve brought the color scheme over for the blocks. In class we have already discussed that the total momentum is constant. So we draw the initial case and then we discuss what the final case is going to look like in order to keep momentum constant. Students are able to recognize that we have a total of -3 units of momentum on the initial side, so we need 3 in the final. Since this is an inelastic collision the width has to be three which means the height can only be -1. Students are already solving collision problems without realizing they are doing math! This felt like a really cool win.
3 – Momentum vs time graphs
This part is something I need to think about a little more. It was something that was “obvious” to me, but was very much not obvious to students. To me, it was “obvious” because you just slap those initial and final values on the graph. The hard part, I thought, was ensuring that you are accounting for each car in the inelastic case.
I absolutely LOVE this representation because this is where students can SEE WHY momentum is constant. The CHANGE of each object is the same size, but different in direction! It’s super satisfying!
The challenges my students had came from notions about what it “should” do. Because the cars are moving together, they want the lines to go together at the end. When I recognized this, we spent a day looking at the representations as a whole and locating where momentum is represented in each in order to construct this graph of momentum. There were a lot of “ah ha” moments when we did this. I think next time I will save this graph for last.
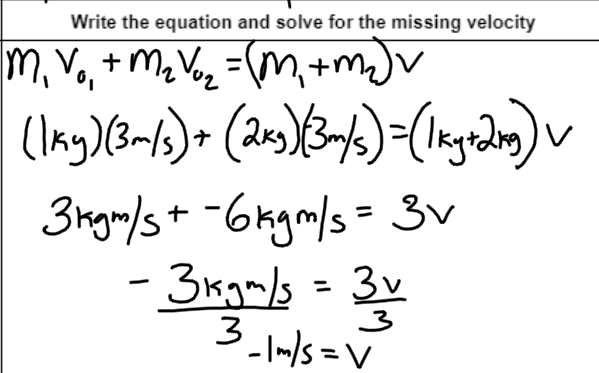
4 – Mathematical Model
The tables are no more! With this mathematical model right next to the other representations, student can see where everything is coming from. The momentum terms, the momentum values, and the final velocity value at the end.
While this was definitely a harder task for students to complete, I feel a lot better about their conceptual understanding of what is happening in a collision. The multiple representations also mean that students have multiple ways of showing me that they understand what is happening.
The first set of posts I wrote for this series was about momentum because I made such a large shift from how I used to teach to how I currently teach.
In the same vein my teaching of forces has also changed.
In the past my force unit looked like this:
Inertia Day! Lots of Demos, initiation into the inertia club with club cards (you hold the card on your index finger with a penny on top and figure out how to flick the card out from the penny)
F=ma. Define it, notes, define force diagrams, practice force diagrams. Practice F=ma problems.
One day on action-reaction. Gloss over it; “it’s easy”
I cringe writing this out now. It was so boring! Inertia and action-reaction felt like fluff. We don’t need fluff!
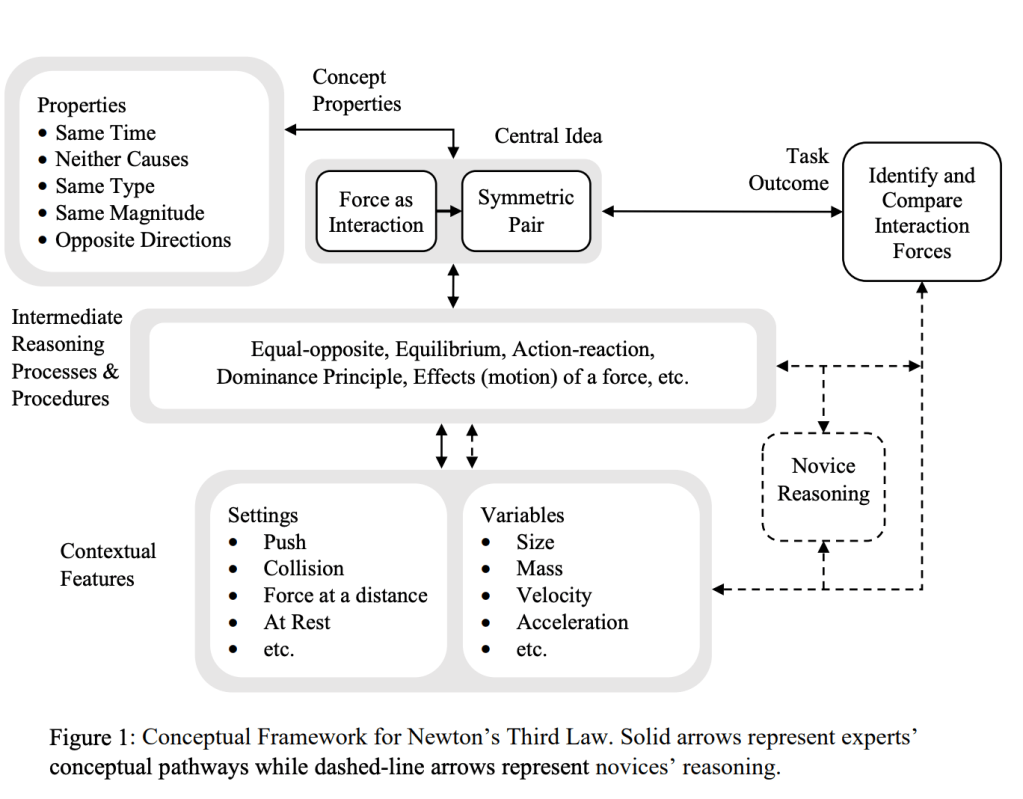
Currently, my unit structure is designed with the big ideas in mind. (Because, tenet 3: Order Matters, Language Matters) I was excited to see that the idea that teaching in a structure that models the thinking we are targetting to improve outcomes is actually supported by research, so my model draws on Lei Bao’s frameworks for force:
One of my biggest frustrations was students putting random “F(applied)” on force diagrams. It irked me to no end!
So starting with the framework for Newton’s Third Law, I turned my force unit on its head. The fundamental piece we begin with is:
A force is an interaction between objects
Observational Experiments
We start with the activity from Pivot Interactives where two cars collide.
Students are asked to separately write what they observe about the car motion and also what they observe about the force acting on each car.
After making the observations we discuss.
The primary aspect students recognize is that heavier/faster cars result in bigger forces. That’s all well annd good, but what about the force that each car experiences. Even though they’ve literally just witnessed and recorded it, they still want the heavier one to hit harder than the light one within the same collision! We closely observe this together and see that, indeed, the forces are always the same.
This is what allows us to define a force as an interaction between objects. Without a second object pushing on the ring, the ring won’t squish. Since the force is something that happens between, it must be equal and opposite.
This very small shift has been a game-changer. It is very rare for me to have students putting totally random forces on objects because “it should have one”.
From here we dive into Eugina Etkina’s ISLE cycle.
Students are asked to hold a heavy and a light object in each hand, palms up and then represent those objects with arrows on a diagram. Students are asked to label each arrow with the object interaction. This is a fun one because a lot of kids are quick to label “gravity” but when I inform them that gravity, is not in fact, an object, they have a moment of pause. Eventually all students arrive at the correct diagrams: equal sized forces on each object, bigger forces on the heavier object.
From here I diverge between AP and regular physics. In regular physics we will go directly to the mass vs weight lab where students will ultimately derive the expression F(earth) = mg. With AP we continue to follow a modeling cycle with experiments with a bowling ball down the hallway: rolling, constant force forward, constant force backward. Then I ask how we could have constant velocity AND constant force. Students are quick to say “push down” (and we are fresh off of projectiles where x and y are independent!). Then realize if we alternate “taps” that will do it (balanced forces). Students are asked to represent and reason by drawing a complete motion map, an accompanying force diagram and then look for patterns. In this way students then recognize that balanced forces will result in constant motion (including v=0) and unbalanced forces result in accelerations. For homework students will complete two exercises from the Active Learning Guide from Etkina’s book where they will continue to practice drawing motion maps and force diagrams together in order to find relevant patterns. From here we get ready for labs!
Up next… labs labs and more labs! Quantitative Experiments with Forces
As a high school teacher homework is a constant battle.
At my high school it’s an equity issue. Many of my students lack the time, space and resources to complete homework.
But also, we also know that the fundamental differentiator between excellence and mediocracy is discipline and deliberate practice. And on a very fundamental level “use it or lose it”. So how to ensure practice and ensure it in a way where learning is happening for all students?
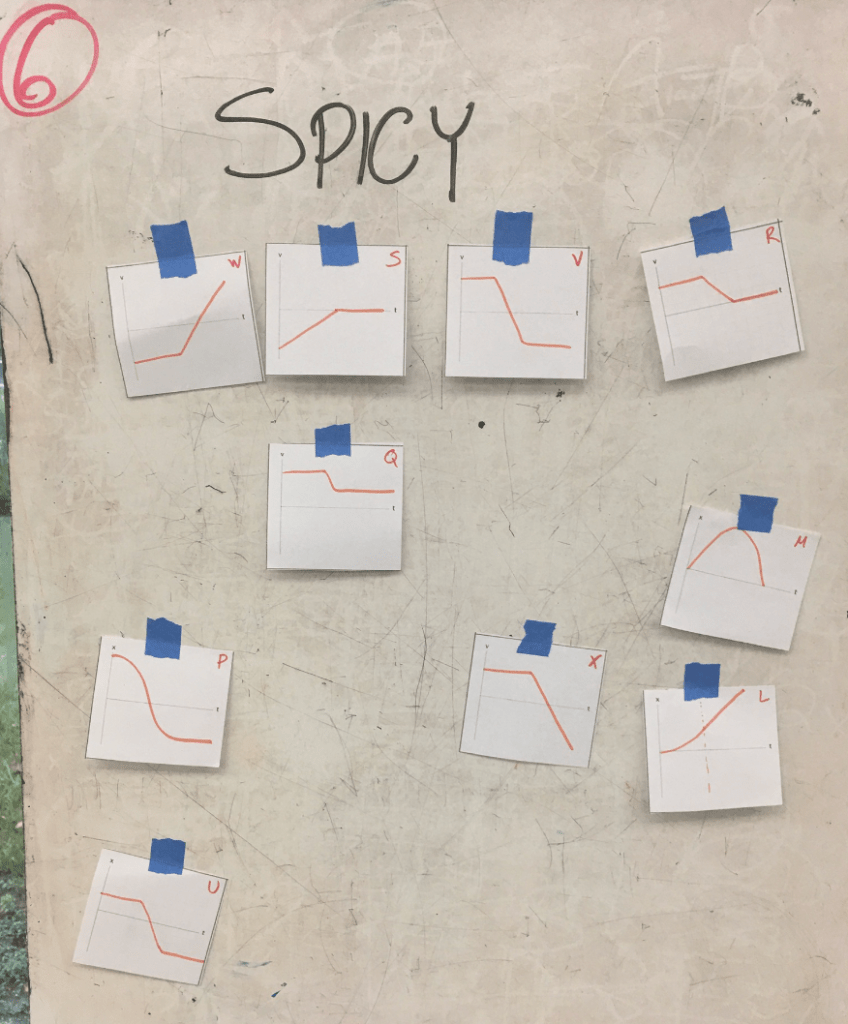
Enter Mild, Medium and Spicy questions.
I picked this idea up from Peter Liljidahl when he joined our nationwide physics book study in April on his book Building Thinking Classrooms in Mathematics. He’s been researching this type of practice most recently in classrooms and I was finally ready to give it a try.
I knew that my students needed some extra practice on calculating quantities from kinematic graphs. They just weren’t quite there yet. I could have assigned problems. If I did, I’d get a 25-50% completion rate and mostly students who did not need the practice provided.
Instead, I did the following:
1) I made a variety of position, velocity and acceleration vs time graphs. Mild graphs had one segment, medium had 2 and spicy had 3 or more. Then, I wrote out the solutions to all of the problems. I put the problems up with tape on 3 individual whiteboard for the three flavors. The answers were on a cabinet on the other side of the room
2) We reviewed the previous week’s quiz and identified that this was the area that needed work. I explained to students they could choose the problems, gave them a paper to document their work, and pointed out the answers were provided.
3) I kid you not, I had 100% of students working for 100% of the hour.. to the point where my last class of the day (who normally line up early) were shocked that the bell rang!
Why it works:
1)Taste vs Aptitude Instead of “levels” the questions are sorted by “flavor” there is something psychologically motivating about choosing your preference rather than feeling pigeonholed by ability.
2) Do What you need – give students a task with a number of items and they want to finish as quickly as possible. Alternatively, the task is overwhelming and they don’t even begin. A single graph at a time, that is student selected (hello autonomy!) is manageable. There’s no pressure! No pressure to complete a spicy, no pressure to complete x number of problems. Just do what you need. I had two students go for the spiciest spicy. I made a comment about it and they asked me if they did it correctly if they needed to do more. Ironically, because it was so complex they were going to end up doing 7 different problems in the process anyway!
3) Get to the deep stuff – honestly, the best part of this for me were the conversations I heard students having. Some of them would get into heated arguments about the correct answer, even though they could have just looked. But just looking was like skipping to the end of the movie. The puzzle was more important than the answer. (I’m going to remind folks real quick that this is NOT my AP course)
4) Student Wins – I heard several students comment that day “I feel smart in this class.” and I cannot tell you how big of a statement that is coming from this group of students. If you know, you know.
And while the practice itself is valuable without the need to do more beyond the retrieving act, I really like to add student discourse to the mix.
Today we did retrieval with a homework problem. I’ve also done something similar with notes from class. One of the keys in this activity is color coding.
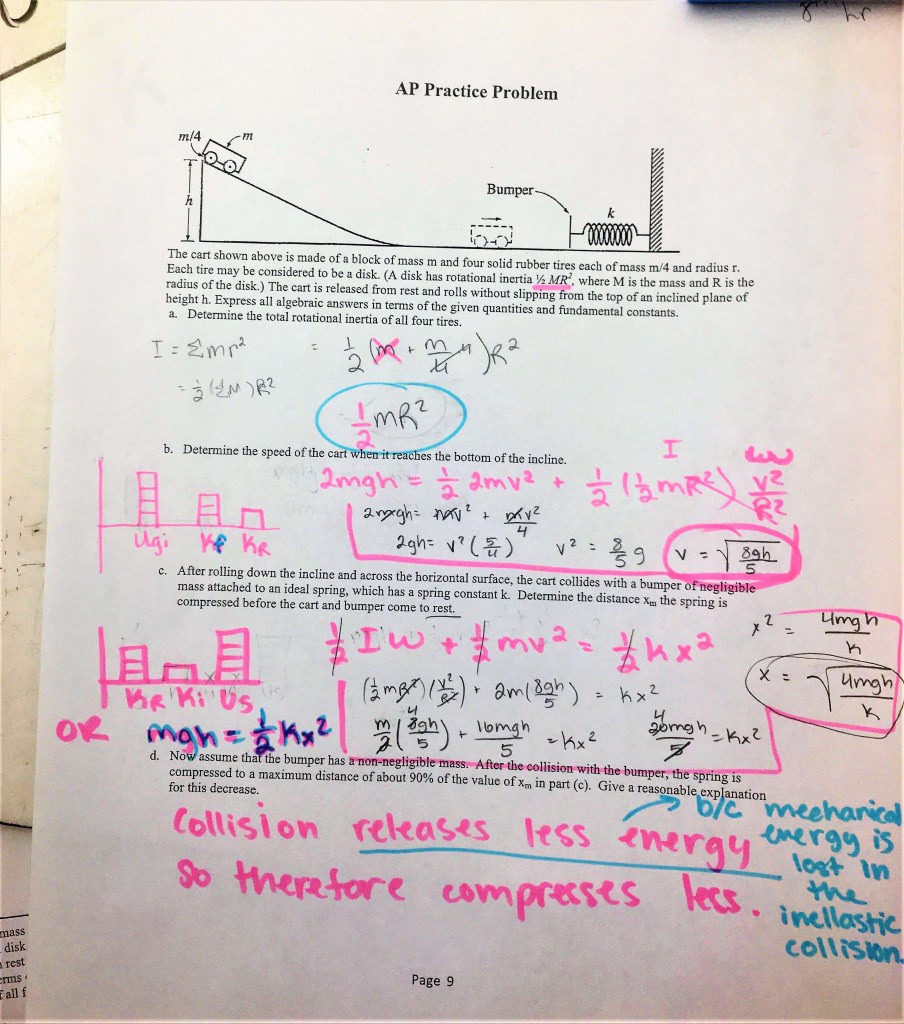
My students were given an AP problem to work on over the weekend. When they arrived in class today I informed them we were going to discuss the problem but don’t pull it out! I proceeded to give students a blank copy of the problem. Students had 10 minutes to complete the problem using only their brains.
In phase two I had students discuss the problem within their table groups. At the beginning of the year I had put students in groups based on the scores of their cognitive reflection test. Students were initially in mixed groups with the hope that reflective ideas could spread. Unfortunately this backfired a bit as students on the lower end started taking passive roles. For this semester I put similar-scoring students together while also accounting for the personalities I’ve come to know. This means that I knew when I had students talking they were working in similar-ability teams. As students added or changed answers they highlighted the revisions with a highlighter.
For phase three I counted off students in groups of 4 so ideas could spread and mix. Again, students highlighted anything they added or changed with a second color.
Lastly, I went through the solutions formally, but because they had spent so much time on the nitty-gritty I was able to talk about the problem in terms of the big picture. Any lingering revisions needed to be coded in a third color.
When we finished I pointed out that the colors give them an idea of where their studies and focus need to be. Start with the first color: they have lots of resources to help them with those ideas. The second color required a spread of ideas and perhaps had a few more challenging ones in the mix.
Students commented on how they felt more confident about the work we are doing after this activity, and I just love that the paper creates a really clear visual of where they are. The best part is that this paper is just for them. No reason to feel shame because you’re in the middle of the learning process.
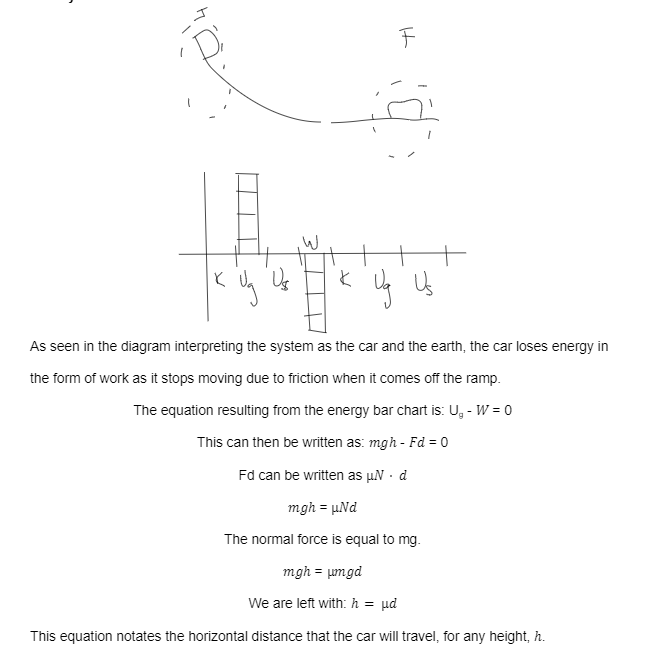
I have this lab I received from a colleague, it’s an iteration of a lab I’ve seen in other places. Basically an object goes down a ramp, gets caught by a paper catch/index card etc and students are looking for some iteration of work and energy.
In the version I have students are asked to find a relationship between height and distance. The cool thing about this is it ends up that height is directly proportional to distance and related by the coefficient of kinetic friction alone.
Student’s work looks like this:
Students are asked to complete the lab with a hot wheel car and then again with a small mass attached to the car. To students’ surprise the lines are not identical. This really bothers students until we discuss what we were actually looking for. See, the lines are still parallel, but the car with more mass is going to have a greater momentum at the bottom and will require a greater impulse to stop. It’s a fantastic conversation piece.
Student generated graph from lab
I really enjoy this lab because it requires students to consider a new problem and then apply that knowledge to a lab setting. Research has shown that students don’t really learn content in the lab, they learn lab skills. I was always a little frustrated with the disconnect between all of the work students put into the theory and then the lab results themselves. So this time I changed things up.
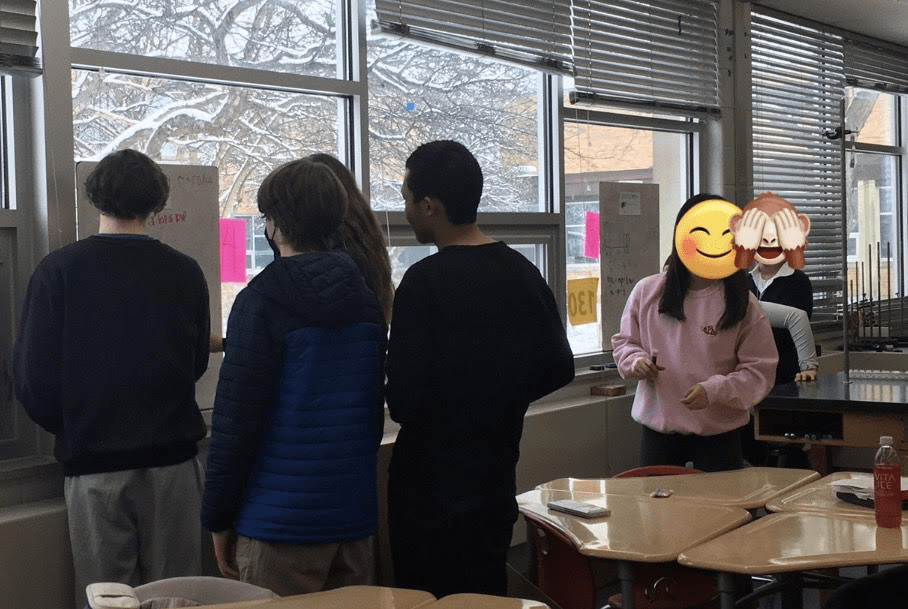
Instead of giving students the lab hand out and letting them work in groups, when students walked into the room they were put into visibly random groups. Visibly random grouping just means you create the random groups in front of students so they see it was truly random. I’ve been immersed in the book Building Thinking Classrooms and the research on this is really cool.
Once students are in their groups and at a white board that is vertically mounted, I’m in the middle of the room at a lab table with the lab set-up. I verbally explain the set up and that I want them to derive a mathematical model for the relationship between height and distance.
Vertical whiteboarding is really cool and has several advantages. First, students are standing which puts them into a more active position, this gets more of them working. Second, it’s really easy to just look around and snag ideas from other classmates. Third, since they’re already standing it’s really easy to move around the room and discuss with other groups. The first time I did this what astounded me was the sheer number of students talking. Instead of it being maybe 4 or 5 leaders it was nearly everyone in the room! There was so much collaboration and ownership of learning it was magical.
Taking a peek to get ideas is easy!
So I did this with the first part of the lab. Next, I asked them to sketch what the graph will look like with the two lines. Almost all of the students sketched the two lines on top of each other. I want them to have the experience of their data not aligning with their previous ideas and having to reconsider, so we left it at that. Then students were off.
I’m going to finish this lab this week, so I’ll have to come back to update this post, but I love this activity and vertical whiteboarding gets a 10/10 every time.
After over a week of work and various representations and practicing energy bar charts we finally dive into the math. We’ve already created mathematical models for spring energy and gravitational potential energy and I give them kinetic. Now we begin.
I want to press on the students that there isn’t an “equation” for energy problems that they are looking for. They need to determine thee equation from their bar chart and physics they already know.
We will start with another example problem and generate the equation through the bar chart. Students then have the opportunity to try a bunch more iterations on their own. This is about the time I will do the hopper popper lab energy style.
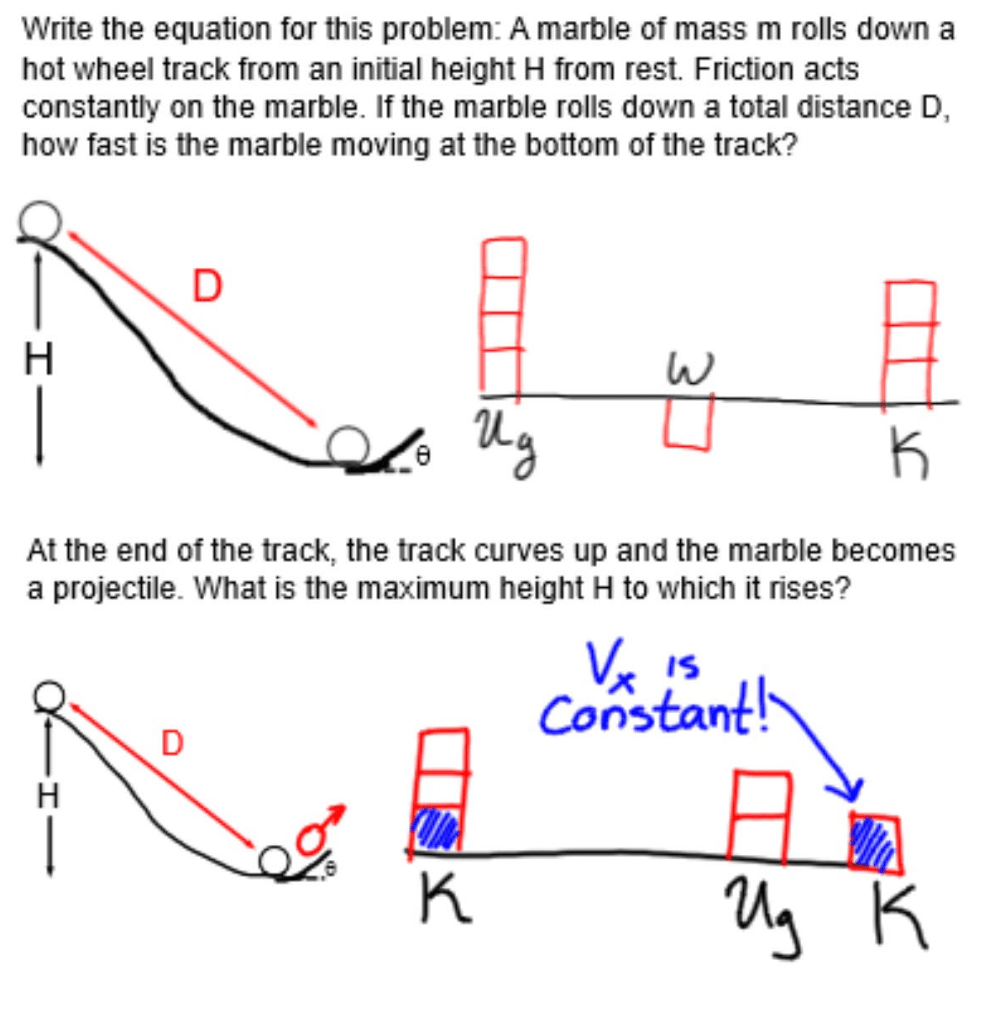
In AP I will open the following day a step further by giving them the problem below as a warm up (students do NOT have the bar charts provided!)
Students are first asked to create the bar charts because there’s no point in trying to write equations and solve for anything until the bar chart is correct. In the first part most students will neglect to include friction. In the second, students will say the ball only has potential energy at the peak, forgetting that the horizontal component stays constant!
The purpose of this exercise is twofold: first, it’s a great opportunity for interleaving. Second, it demonstrates to students they need to be ready for anything!
This year I’ve been incorporating vertical white boarding from Building Thinking Classrooms in Mathematics and it’s been truly amazing. After this exercise we went to vertical boards where students had two more problems, one was straightforward with friction while the other was solving for the height of a ramp needed so a ball can just make it around the loop.
The following day students engage in my conceptual whiteboard challenge where I help scaffold an expert approach to problem solving.
Training #APPhysics1 Ss to be direct and concise. Ss worked problems yesterday; today I required their reasoning to be brief. After providing some guidance about what each sentence should contain, the next Qs I asked them to explain on a certain # of statements. #iteachphysicspic.twitter.com/iRI6r6NQaq
We move into energy conservation pretty quickly. Similar to our introduction to work, I pull on prior student knowledge. How many energy forms can you name? As students list them I copy them on the board, sorting them into mechanical and non-mechanical forms. Once we’ve exhausted this list I give them the category names and also the definitions of potential energy as energy of position and kinetic as energy of motion. We discuss how potential energy requires a position that can be measured within the system.
One of the best ways I’ve learned to support students is to teach them to create bar charts. I’ve seen many iterations of this, in the modeling community these are LOL charts. I, personally, haven’t been convinced to continue to use quite as much time on the systems part as many in the modeling community do (literally for the sake of time) but the key feature here is that we are taking concepts and translating them into a kind of visual, mathematical model.
So this is what we do first. We do a few examples (it’s like a checklist!) and then students are on their own for some samples. Emphasis is placed on the process:
Identify your initital and final states
Sketch a picture of each state
Identify your system
Identify which energy/ies are present
If there is a change between initial and final then we need to include work.
Double check that you have, in fact, accounted for any possible external forces that may have done work.
I show students how defining different systems can still get you to the same answer and WOW! Work done by gravity is the same as the potential energy due to gravity… the difference is the system.
I actually have the COVID-lecture version of this video when I wasn’t able to run this lesson with the whole class. While you’ll notice I do go into the math here, it’s really not an emphasis until later. In my regular class I don’t touch it at all until the next day
Interestingly enough the work and energy unit/chapter has become my litmus test for whether or not I’m going to invest time in a resource. It was what spurred my frustration with The Physics Girl’s AP review series (although I’ve learned that when you’re actually commissioned by someone like PBS you have to bend to the whims of the corporation).
So what’s the litmus test? Open the resource to the first page of the Work & Energy chapter. If you see “work is defined as force times distance” close it and move along! First of all, let me be totally clear, that was me early in my career. I taught that work was the dot product of force and distance, we did a lot of different calculations and then we defined energy and did conservation of energy. My frustrations began with the fact that students were not transferring the idea of work over to conservation of energy. They deepened when upon reflection I realized my angst was because the core idea is not just that “energy is conserved” but that work causes a change of energy in a system.
I start by asking students to name types of work. The list looks something like this:
Homework
Housework
Yardwork
work work (a job)
Wood working
and so on…
Then I ask students what is shared amongst all of those ideas. I’m looking for two answers, that they all require effort and that they all end in a change: Do your homework and your brain grows, work a job and you get paid… and so on.
So then I give students a list of tasks: lifting your backpack, holding your backpack, dropping your backpack, walking with your backpack (at a constant speed), climbing the stairs with your backpack, and I ask students which of the following are an example of doing work. We don’t share answers quite yet because I don’t want to participate in “expose and shame” where we trick students into marking the wrong answer. After they come up with this list then we formally discuss work as “a change in energy of a system due to the application of forces”. I emphasize the change which is in alignment with our original definition and “application of forces” which is the “effort” part they mentioned earlier. We go back through the examples and have a discussion about which are work and how.
Note: We’ve already discussed systems when we did forces, so there is a review of this idea as well.. the concept of systems is critical to student understanding of work and energy so if you’ve not done systems yet you need to hit this hard!
I’m going to include a few of the sample problems we work together in class to hit different ideas:
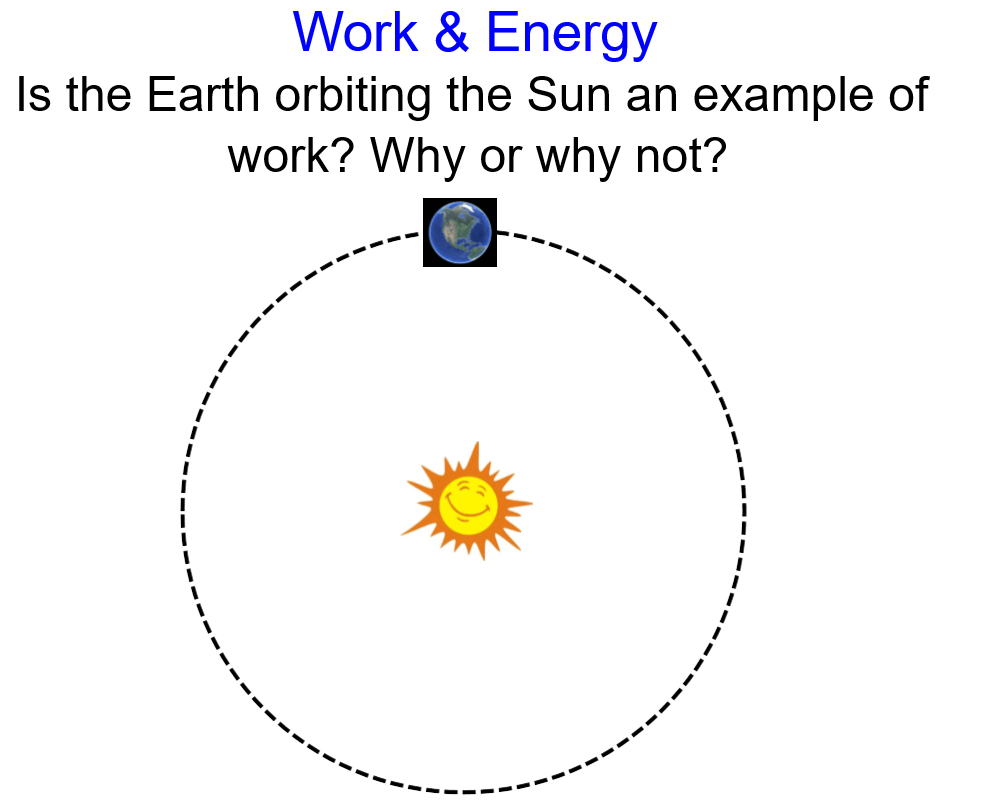
I ask this question right after our intro to work. I let students come up with lots of ways to reason the answer. The “correct” answer is that the force is perpendicular to the displacement, but this is also a good time to discuss that a “before” and “after” snapshot would also look identical, or that with each orbit the displacement is zero!
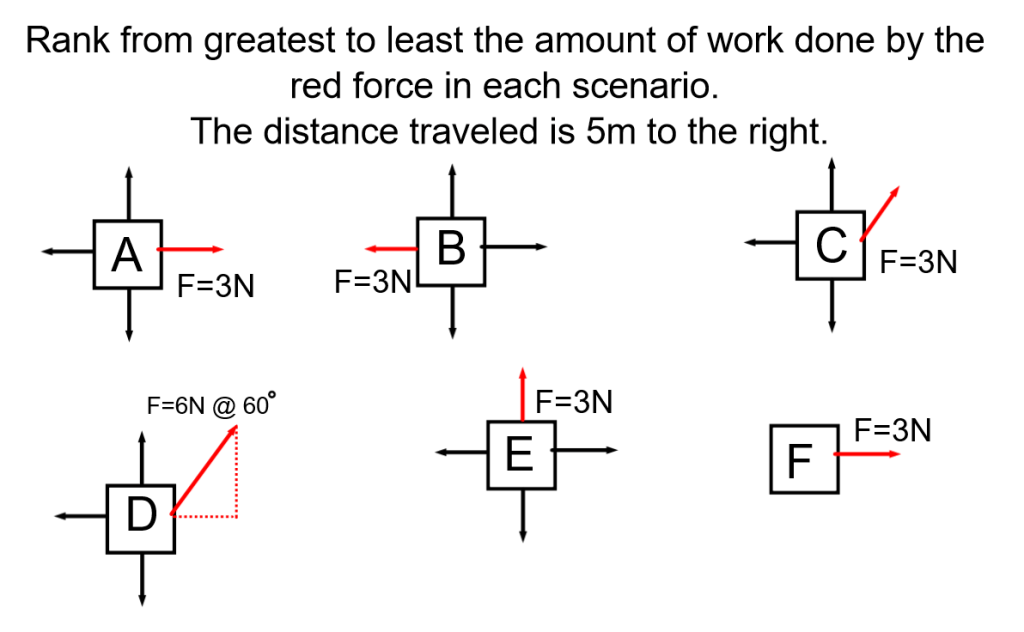
I ask this question in two ways: first as presented, then I ask them how the ranking changes if they were asked about the work done on the OBJECT. This is also a good place to discuss what negative means in the sense of work (positive work ADDS to the system while negative work takes away from the system)
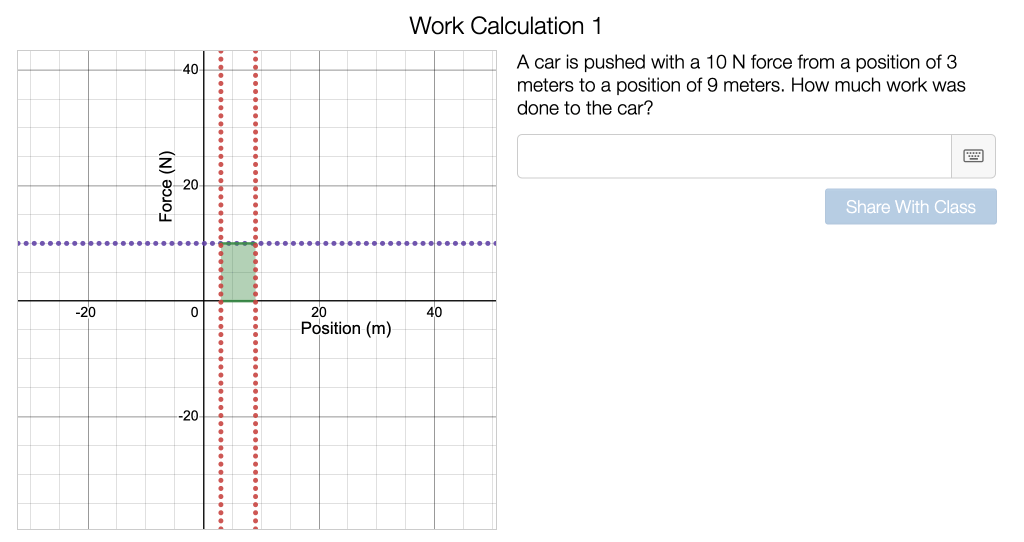
Also of note: in AP I tell them that any time they get a graph they should ask themselves “does the slope tell me anything, does the area tell me anything” slope is essentially dividing the properties while area is multiplying (I know this is a major oversimplification, but it’s an algebra based course). I show them a graph of force vs displacement and ask how they find the work done (area!) they have a few practice items with these.
We run the spring lab where students discover Hooke’s Law and then I ask them to determine the amount of work done on the spring. Most students are able to get to the idea that its 1/2kx^2, but I do always have a few groups that want to just sub in kx for force and end up omitting the 1/2. This is a great conversation to have in a board meeting.
In my regular classes I run this great desmos activity I found by another teacher (try it out here).
First, students move the sliders to make the graph match the scenario…
Then that graph is reproduced on the next slide so students can use it to perform the calculation
This familiarizes students with graphical representations and the idea of how positive and negative work affect the system. I added one last slide to the original asking students to review what they learned in the activity and predict the work done by the spring in their lab
When we are ready to move to energy, I open with the following question:
A ball is dropped from rest.
Define the system to be just the ball. Sketch a diagram showing the ball and the earth and identify the system by drawing a dashed circle around the objects in the system. Include any relevant forces. Is work being done on the ball? Explain your answer.
Define the system to be the ball and the earth. Sketch a diagram showing the ball and the earth and identify the system by drawing a dashed circle around the objects in the system. Include any relevant forces. Is work being done on the ball? Explain your answer.
This is a great way to talk about how the same situation can describe work or not. The gravitational force is clearly inside of the system in #2 and therefore is a NON example of work.
We’ll discuss how I move from work to energy another day!
At some point while considering equitable grading practices, I found myself searching the archives of TPT looking for some ideas regarding retakes. While I appreciate the idea of an honest retake, my experience has been that it is simply more time and effort on my part, and minimal effort and a hope to just “do better this time” on the part of my students. I ran across Jeff McManus’ article regarding the “box score” (“Retests”: A better method of test corrections)
In short, when the students turn in their exam, they receive a blank copy of the exam and they get to redo it, using any resources. If the redo is perfect, their old score gets a bump on the square root curve. I liked this notion, but had a dilemma—my exams in AP Physics are taken from secure college board documents which are not to leave my classroom. Additionally, I knew that certain groups of kids would work together, while others would not take the initiative to join a group, attempt to work on their own, and not reap as much of the benefits. Not wanting to lose the integrity or security of the exams I needed to make a modification on the assignment.
I informed students of the opportunity to do a retake. Since they needed time to really work the exam, I offered them a “collaboration day” during lunch (our students have a shared lunch hour). The retake would be the following day at lunch as well. (Collaboration day came and I was enthralled. Two thirds of my students came (this has increased to as high as 80%) , received a blank copy of the test, and started talking and working together. Large groups of students formed around white boards to tackle problems, the energy was palatable and the camaraderie was invigorating. Since the students had no number to form an idea how they had actually done on the exam, there was a wide range of abilities in the room.
It’s the big collaboration day before the retake! Ss must get 100% to get a bump and 85% of Ss showed up today! The energy in the room is palpable and invigorating! #iteachphysicspic.twitter.com/TC8M8a6Uni
One of my best students commented to me after collaboration day, “I thought I did really well, but I realize there was a lot I didn’t know” The need to score a perfect in order to obtain an increase in points also motivated students to grill each other for explanations until they understood and could reproduce the work themselves.
Retake day arrived and I had a full house. Students were able to finish their previously 40 minute exam in 20 or less because they knew how to attack the problems and most students were able to perfectly answer the problems.
I struggled, however, with the notion that students might memorize steps to a solution, rather than it being truly valid. I added a reflection component to the retake. Students needed to explain to me what they had previously misunderstood that now they comprehended. The reflections were telling. Students who had obtained 100% on the exam could clearly indicate their faults in either concept or problem-solving approaches. Students who were unable to obtain 100% were unable to adequately reflect on what they misunderstood.
I have continued this practice, in particular with the energy exam, for the last 5 years since I first came across the article. It is not my first or only method for re-assessments, but it is certainly a powerful one. A few changes and observations I’ve made over the years:
To avoid the memorization piece, instead of testing next day, we test 5-7 days after the collaboration day in order for students to “forget”
I had a really hard time not bumping a student who earned a 60% and then got all of the FRQ right and missed one MC. So I do a half-bump… so if the full bump is 10*sqrt(60) = 77, the half bump is 77-60/2 = 8.5 60+8.5 = 68.5, which I’ll likely round to 70 out of generosity.
I’ve had one instance where a student with extreme anxiety and perfectionism this was problematic. I made alternative arrangements for that student ahead of the retake (they got 100 anyway).