Activities · Teaching Methods

Paper Companion Activities for Pivot Interactives

You know how I feel about online work! (Looking for Physics Classroom Companion Worksheets? Find them Here!)

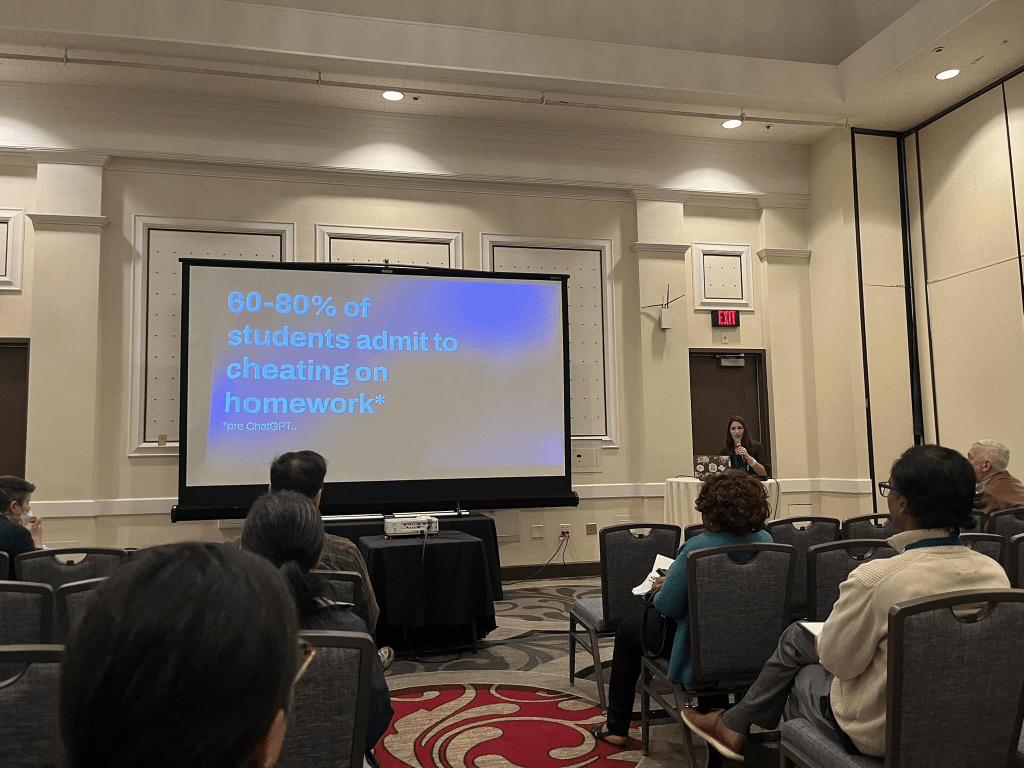
When I took high school physics almost everything was online. From physics classroom assignments, to the dreaded WebAssign, it was online. And because it was online, I like others, gamed the system (pre chat GPT). You know a certain number is going to show up somewhere in the answers? Enter it in all the blanks for the first submission so you can focus on the actual calculations. On the flip side was the part where you tried the problem so many times by the time you got it right you had no idea what actually worked. For the better part of my career I’ve been vehemently against all forms of online homework. There’s something about that screen that just puts a stop to the idea of using scratch paper for novice learners and we can’t have that!

(For what it’s worth, when AP went all digital I did NOT feel the urge to go digital in my classroom. I continued to do everything on paper. When APs came around I found my goal was acheived: I proctored the macro exam and did a count. 80% of physics students were using their scratch paper during the exam, while only 30% of non-physics students used their paper.)

The first exception I made to online learning was Pivot Interactives. I was using Peter’s work back when they were “Direct Measurement Videos” which meant I had paper copies originally, anyway. As Pivot upped their game (including deep randomization and autograding) I started using some of these assignments since it sure made my life easier!

However, what I’m finding with my students this year is that like my Webassign days, students are doing the minimum to get all the green checks. This looks like not reading the prompts that explain what they’re about to do next and why, not actually collecting the data for the graph and totally missing the connections between the sample measurements and the data collection.

So, I’ve started to reimplement some paper versions.

The Activities: A Journey of Trial and Error

Earlier this year I assigned the helmet collisions activity. I added a prompt at the end that requested students to do the following:

  • What was the purpose of the activity?
  • Describe the procedure for conducting the investigation
  • Describe the calculations you made and why we made each calculation. You should include details regarding your values!
  • Describe what we learned from this activity about helmets as it relates to the impulse-change in momentum relationship.

This was ok, but I, arguably did this a bit hastily. I realized I wanted these documents handwritten and maybe a bit more depth/scaffholding.

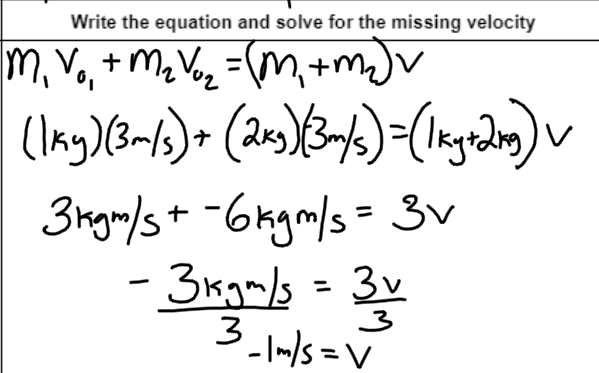
A few weeks later I assigned the Explosions (Not Really) activity.

I knew that students would totally ditch all of the methods we had been using, so I decided to give them a paper to complete before the activity that related to the activity. This required them to complete the calculations with similar, but easy numbers and then have me check their work prior to the activity. This got a good chunk of kids on board, but some still struggled with the transference.

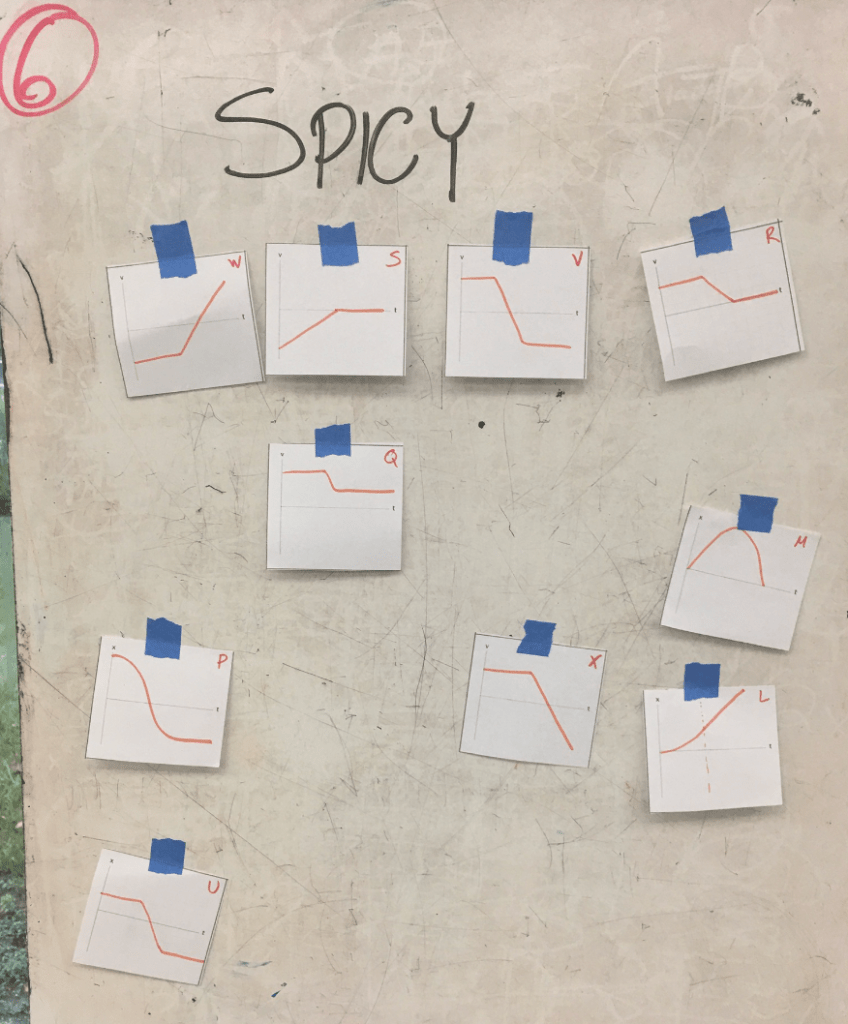
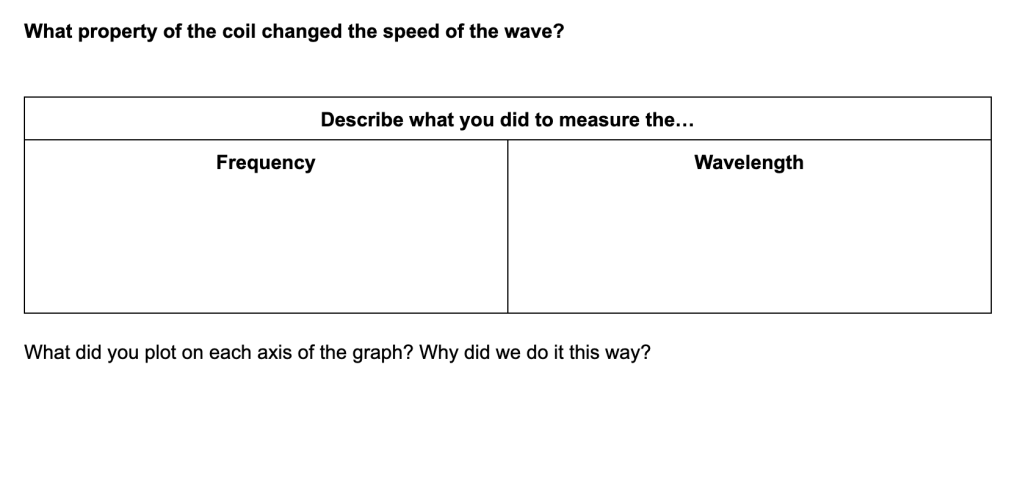
Still not completely satisfied, this past week I assigned the “Intro to Transverse Waves” activity. In this activity students are going to linearize a graph. This is a skill we don’t really cover in my regular level physics, but I like doing it at this point in the year because it’s such a powerful tool. As I anticipated, many students were ignoring the text about linearization completely. I chose a different approach to the paper copy.

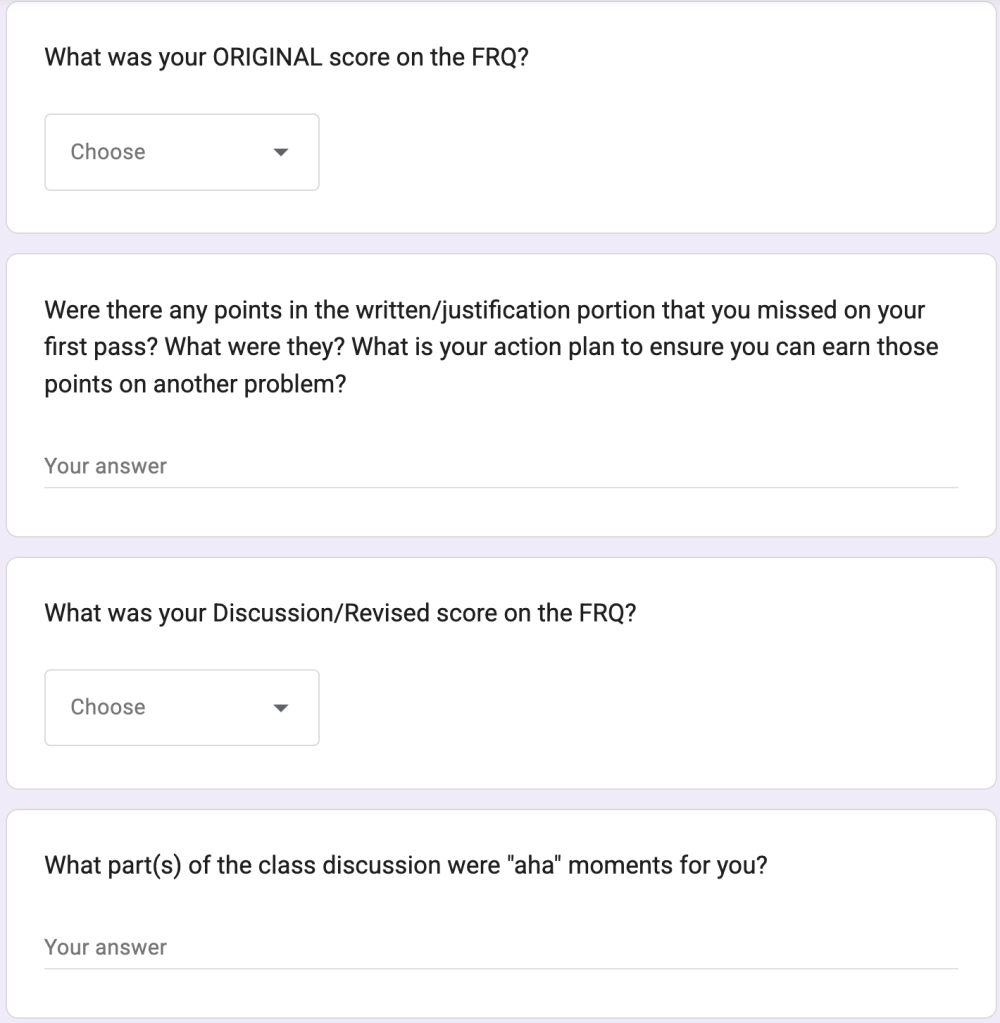
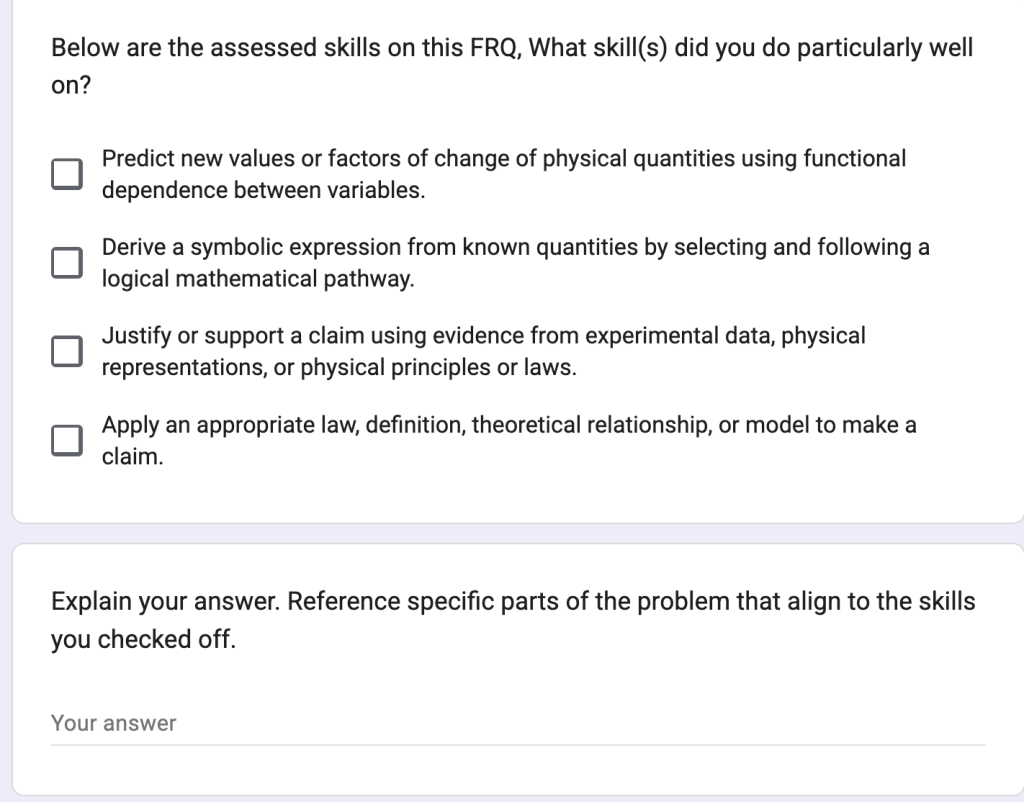
I gave students this document which contains the following prompts:

First, I asked them to describe to me some of the new vocab as well as how we obtained our measurements

Next, I use a modified template from the Patterns Curriculum when students write conclusions in labs where we have graphs. It looks like this:

After investigating the behavior _______________, I conclude that there is a ______________________relationship between the [independent variable name]  and the [dependent variable name] As the [independent variable] kept increasing, the [dependent variable]_____________________________. This system of a ___________________ can be mathematically modeled as:

[write the final equation]

where the constant  [slope value]  is the [description of slope for this experiment]

I require students to write the ENTIRE paragraph from start to finish. This is not a fill in the blank activity.

This is currently my favorite interaction of the paper follow up and I’ll probably build more of these moving forward. I’m really in love with the patterns physics conclusions because it really requires students to put everything together.

Grading

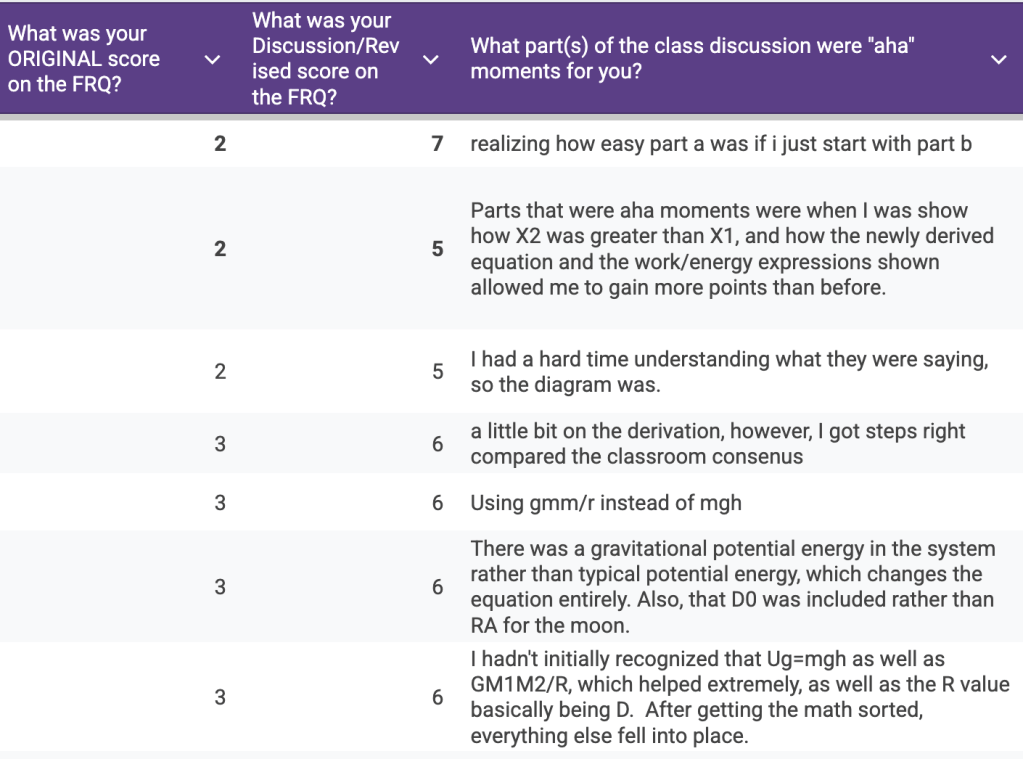
I’ve noticed there’s a VERY strong correlation on these summaries between students who took the activity seriously and learned from it, vs students who did not. Because of this, the only thing I really need to grade with care is the conclusion paragraph itself. If students did the lab correctly, this paragraph looks great. If not, they usually don’t do well on this.

Do you do anything like this? What does it look like? How do you support genuine learning using online platforms?

Activities · Teaching Methods

AP Free-Response Practice, Skills and Metacognition

It’s been two weeks since I got back from the AAPT Winter meeting inVegas and I’ve barely had time to sit and reflect. I’ve made some big changes this school year. Exactly one year ago I interviewed for the AP Physics position in a new district. It was one of the more challenging decisions I’ve needed to make in my career, and the first time I was walking into an interview fully confident of who I am as an educator, what I want in my future and in complete control. (When I took my position at Auburn I was confident, but hadn’t yet taught an AP course). With a new position comes new challenges and adjustments, but a new position paired with experience and confidence also brings the opporuntity to recognize challenge for what it is: an opportunity to search for innovative solutions. That’s one of the best parts of teaching; getting challenged in ways that require creativity.

With challenge comes a heavy mental load and so when the deadline came around for the AAPT abstracts I quickly threw together an abstract related to holding students accountable when we do work a la Building Thinking Classrooms (Accountability on Ungraded Homework) but had only shared here on the blog. A part of me felt pretty lame as this particular idea didn’t feel as exciting as I thought it should be for presentation, but I’ve learned that we are typically our own worst critics, and it’s always valuable to go ahead and present anyway. (Here are the presentation slides)

As it turned out, my session was loaded with three other awesome talks that all complemented one another really, really well. Aaron Titus talked about his “how to test better” workshop which is secretly a “How to Learn” workshop. Another faculty member talked about standards based grading at his college and Kathy Willard at Case Western talked about some metacognitive work she’s engaging students with. This session, tied with the AP sessions that took a deep dive into the science practices got me thinking about how to put all of this together to support my students.

The result? An FRQ reflection form.

Part of this spawned from the fact that we had -30 windchills last Friday and a remote learning day. With remote learning obtaining student feedback is more critical than ever for me, but I realized this would be a good strategy to maintain for all FRQ practice.

The Process

  1. Students complete an FRQ alone under timed conditions
  2. Students flip their work upside down and move to vertical whiteboards. They are permitted the next 15 minutes to discuss the problem and they can whiteboard their work/discussion as they go. This is a riff on friends-no-pens due to the complexity of the problem.
  3. As students wrap their discussion, I ask them to consider how the points are distributed.
  4. Students return to their original work and have 10 minutes to revise/add to their work. The way my room is set up students CANNOT see the work on the whiteboards
  5. Students self-score the FRQ. I ask them to give themselves a first pass and second pass score.
  6. Students complete the reflection

The reflection is a google form. The nice thing about this is that in addition to collecting this data easily, I can link multiple forms to the same spreadsheet to track changes over time.

The Google Form Reflection

This first part is asking students to think metacognitively in a few ways. First, I want them to see the gap between their individual and group-think. In a highly collaborative classroom, sometimes students think they have a better handle on the material than they actually do. The first pass at the FRQ gives them a chance to see what they are capable of alone. The second pass allows them to see that they can and do understand more physics than they might give themselves credit for, but it’s not currently encoded in their long term memory. This gives students a place to identify as a study need.

Next, I use the standards information available in AP classroom to provide students a check-list of the skills that were assessed. I ask them to identify both what they did well on and what they did not do well on.

To wrap it all up I ask a final question to get a guage on what my students believe they need more of.

Looking At Results

Below is a snapshot of some of my student results and reflections. I sorted the original scores from lowest to higest so you can see the improvements. This was a Translation Between Representations question which is worth a total of 8 points.

First, observe how much scores increased from original to group think! But what I think is particularly important is that this work happened without access to notes of any kind before and after conversation. When students return to their papers they no longer had access to the whiteboard work.

Next, I think some of the “aha” moments are particularly important and poingnent. I especially love the first one that is more about testing strategy. (This particular student is a rockstar, but the physics assessments have been rough for them).

I thought this data was particularly interesting:

I think anyone who teaches AP knows kids dread the word “derive” like we’re asking them to be Einstein Geniuses (more on that in another reflection another day). Interestingly, my students reported that they all need help on derive, but actually my data from AP classroom and testing informs me that functional dependence is actually one of their weak spots. And yet, students aren’t overwhelmingly identifying it as one. I’ve determined that this particular blind spot is going to be an area of focus these last few months as we enter the final lap.

Asking students where they struggle is always telling regarding their thought processes. Currently many of my students are still stuck in a very algorithmic way of thinking/approaching physics rather than working big picture down and it remains telling in their responses. This is still really valuable information because in order to get students where I need them to be I need to meet them were they are at first.

In My Class Today · Science of Learning · Teaching Methods

Accountability on Ungraded Homework

In Building Thinking Classrooms the way that students approach homework is different. The idea is that we know that homework is intended for practice however students often end up doing homework either to satisfy their teacher or to satisfy their parents. The result is a lot of cheating. One of the small shifts around homework is to simply change the language to what we intend, “check your understanding” However, in following the tenets of insuring student autonomy Liljedahl sets forth 4 more rules:

  1. Don’t ask about it
  2. Don’t mark it
  3. Don’t check it
  4. DO use phrases like “this is your opportunity

One of the neat tools for opportunity that I learned was offering “mild, medium and spicy” problems. The problems are a matter of “taste” rather than “level” and there is no expectation around how many are accomplished, just that you keep working. Students do a great job moving themselves up as they gain confidence. This year, to my glee, I actually had students ask to post the problems online so they could do more!

As fun and as engaging as this is, I still felt like there should be some way that students are accountable for their work, but in a meaningful way. So here’s what I’m doing this year:

We have work days where students might have Mild, Medium and Spicy problems, or maybe just a standard problem set. I post solutions around the room for students to check their own work as they go. This not only keeps them moving, but it also means that the questions I’m answering are a little more meaty than “is this right”. Much of the simpler questions can be answered within student groups, giving them some independence.

Following the guidelines around homework I do not have students submit the work. It’s not checked, counted or graded.

There IS, however, follow up. It lives in a google form and I ask students to evaluate themselves and then do a little more thinking so I can see where they are.

The first part of the form looks like this. I’m asking them to self-evaluate on each of the learning objectives. The four categories are akin to the way in which I will ultimately grade their assessment, but in very simple terms.

Next, students have 2-3 items that are reproduced from the solutions of the work they engaged with during class.

In this example students received a stack of position, velocity and acceleration graphs that all were associated with the same motion. I provided a photo of the key (above) followed by these prompts:

What’s great about this is that the part “A student asks this question…” are real questions I get from students! During the activity I often hear these exact questions during the work, which gives the student a second opportunity to reflect on this and address the misconception (these questions come from experience, I’m not making the form during class) Something I’m realizing I did not do consistently was first ask “why would your classmate think this” before asking how to correct the response. I’ll need to update that for next time!

Looking at the student data is really cool!

First, I get a sense of where my students believe they currently stand on the work.

I can see that we need to gain confidence on sketching a velocity graph from a verbal description (which surprised me, because in my expert blind spot that feels like the easiest one to graph!)

I can also disaggregate between how students think they are doing, and how they are actually doing.

The question referenced here was a standard free-fall parabola on the position graph(concave down) Yet 2/3 of students who attempted it did not answer some portion of it correctly!

There are some really great student responses to the question I asked about this item. Some better than others. This gives me a great launch-point when we get into free-fall specifically

I think the next step here is to overtly integrate the results from these feedback forms into class instruction. I want students to be able to make a strong connection between the practice we do in class and how it can impact their learning, even if they don’t get credit for the actual practice.

In My Class Today · Science of Learning · Teaching Methods

Note Making in an Active Classroom

I like to be challenged. In the last year as the Science of Reading has surged in use/popularity so too have the direct instruction advocates. Specifically in my space I’ve seen a lot of attacks on student-centered instruction (the type of instruction that is promoted by the National Council of Teachers in Mathematics and the NSTA) which argue that an emphasis on student thinking and problem-solving is harmful to all but the top tier students.

None of us educators who truly care about the craft are blindly and deliberately acting every day in ways to exclude students. Most of us are intentionally considering what is presented to us and how it impacts our students in the classroom. I graduated college fresh on the latest expression of inquiry-based learning making its rounds as all the rage. At that time the idea was to let students explore and then let them go where they wished. This concept drove my first day activities where my students play with various demos and lab set-ups, but it was very clear that the kinds of questions and ideas students would come up with on that first day were predictable and lacked meat. True to the advocates of direct instruction (DI) and grounded in cognitive science, the more you know the better questions you can ask.

My first year teaching was also a shift from my previous experiences in affluent schools to one where the majority of my students were highly dependent learners, for various reasons. I quickly realized that I needed to scaffold most of the resources I had from student teaching in order to support students reaching the intended goal.

In the years that followed I had a wealth of opportunities with student groups. I ended up teaching everything from co-taught freshman physics to honor’s physics at that first school and then everything from kindergarten astronomy to middle school integrated math at Northwestern’s gifted enrichment programming. Then I was back at my old high school where I tutored over 2,000 different students in science and math. That experience was eye opening in terms of how instruction impacted students, and yes, some students need more direct support.

I attended my first Investigative Science Learning Environment (ISLE) in the summer of 2018 and it was earth-shattering. Roughly a decade into teaching and the method from Rutgers University gave language and research to many of the things I had figured out along the way.

In 2022 I discovered Building Thinking Classrooms in Mathematics and in 2023 I attended a workshop with the author, Peter Liljidahl. At that workshop we focused on the later-half of the book which is arguably the most difficult to understand how to execute from the text alone. Peter explained to us that in their research what they noted was that consolidation and note-making were the critical components that made the different in lasting learning. Let me reiterate that: Peter himself shared with us that random groups, vertical whiteboarding, thinking tasks are easy to implement and certainly promote engagement but in order to get the learning to stick, the consolidation was key.

I started thinking about this in the context of any kind of active learning environment. In ISLE students go through the process of observational experiments and testing experiments and are also “representing and reasoning” along the way. After each round students are supposed to be “interrogating the text” and then practicing with problems. This works great for my gifted AP level students, but as many of us have found other student groups need more scaffolding and support. During the workshop Peter shared his latest idea for note-making.

Some context from the book. Everything is about considering the psychological messages we send to students about our expectations and their roles, and how we can make moves to flip that to re-center the student and their thinking. As renowned cognitive psychologist Daniel Willingham points out, thinking is hard and our brains do everything possible to avoid it. At the same time we also enjoy puzzles and figuring things out (did you do wordle or connections today?). In the book the idea is that notes are something that happens after engaging with thinking and in a way that you continue to think while making (not taking) the notes.

Think about that for a second. When you take notes in lecture how does that go? Are you furiously copying everything and then find yourself not remembering the actual lecture? Are you trying to furiously copy and then falling behind, leaving you frustrated? Or do your prior experiences prohibit you from taking any notes at all so you give up. We know that the act of note taking is helpful for remembering, but there are also a lot of barriers and challenges when trying to get a group of 30+ individuals to all obtain the information pertinent to their learning.

The book discusses having students “go make notes” and to write things down for “their future forgetful selves” which is a good framing, but I noticed in class that many of my students were still unsure about what that would mean.

What it Looks Like

At the workshop Peter shared this really cool template (these are my notes from the workshop):

Check it out! It’s all the things the DI folks love to share are necessary and supposedly non-existent in a thinking classroom. The top is structured by the teacher. In fact, it’s two worked examples. The first is for students to fill in the blanks while the second is a similar, but different example. The bottom half is for student autonomy, though it should be noted that the “create your own example” can come from homework, the textbook etc.

The way this was presented was that students would create these notes on the whiteboards and then transfer them to their own notebooks. I cannot fathom running a lesson, and then doing the notes on boards and then having the transfer happen, so I needed something different.

Meaningful Notes in My Classroom

What I chose to do was to create the template and provide it to students with that teacher part already prepared. Here are a few samples:

This first set is what students completed after doing the observational experiements dropping bean bags behind a bowling ball and creating their first motion maps:

The following day I have students engage in a desmos sorting activity to continue working with motion maps as we continue the reasoning process. ISLE folks will recognize the content that is directly from the Active Learning Guides:

Next I borrow from the AMTA curriculum to start translating representations. The top half of this page was all work we do together on whiteboards.

Here’s what’s been really cool about using this style for notes:

  1. Students (and I!) are able to recognize what actually translated/processed during the class discussion. Since the first box is often work that was exactly from the discussion and whiteboarding we can hit those problem areas right away using the discussion we just had.
  2. The example is manageable. Instead of giving students 5-10 practice problems, they have just one they are required to complete. This example is either very similar to an example that was done in class or identical to the example done in class, but the example is no longer available to copy (yeah, I’m sneaking some retrieval practice in!)
  3. As students work on the top half and we have those conversations about what they are stuck on or missed I’m able to say “ok, that’s something you should probably put in the things I need to remember box!” This is also true any time I hear a student go “oooooooh!” when the lightbulb turns on.
  4. Create your own examples are actually pretty decent! Sometimes they are pretty similar to the first example, other times I see students stretching themselves.

The notes that get submitted also paint a great picture of where my students are at. Check this one out. This student is pretty quiet in a class of students who are generally super vocal and asking for my help frequently.

I’m able to make a few judgements here from the work. First, this student doesn’t yet understand how to represent stop on the velocity vs time graph. Second, even though that’s the case, she does have a pretty good handle on what they were supposed to learn in the lesson that day (see the “things I need to remember”)

I’m still experimenting with this and finding ways to adjust and ensure that students are ultimately getting what I want them to get from the notes. I do feel, however, that now the notes that are on the papers are resulting in more meaningful work than when I’m expecting them to copy as I work on the board. I can still craft these so students get what I want them to get on the paper, but also provide space for autonomy and small wins to build confidence.

Activities · Teaching Methods

I revised the cannon launch!

In my last post I talked about how I finally reenvisioned collisions and explosion problem solving for my on-track physics. It went so well I’m definitely going to integrate more of it into AP.

The goal of the reenvisioning was to set students up for a meaningful tennis ball cannon launch lab at the end of the lesson sequence.

If you’re unfamiliar, you create a tennis ball cannon, launch it, and have students calculate some quantity based on momentum conservation. To be honest, I haven’t run this lab since my first few years teaching for a few reasons. One was that my cannon got stolen at my first job. Then I decided that whole class labs are less effective than small group work and I hate when it looks like everyone is copying answers. The activity just wasn’t meaningful enough.

But after talking to several friends, everyone was excited about the idea of a cannon launch, so I spent my weekend rebuilding a cannon.

To open the lesson I set up and demonstrated an “explosion” with our car-track system. I ensured that one car had more mass than the other and we had some conversations about what to expect. We also talked about what the equation would look like based on our previous experiences with elastic and inelastic collisions. Students were able to correctly determine that it’s basically the opposite of an inelastic collision.

Next, I gave them the scenario where the cannon had a mass of 4.0 kg, the ball had a mass of 1.0 kg and the cannon’s launch velocity was 5 m/s. These numbers were strategically chosen. I wanted to keep whole numbers and also have a cannon-ball ratio that was similar to the actual cannon-tennis ball.

Students then completed the four representations as we’d previously done earlier in the week. Below is a student work sample.

The great thing about this was that students were able to accurately represent and predict the outcomes of the cannon-ball system before we got into the muck. This got students thinking individually and talking in small groups. We also discussed why the results made sense.

To launch the cannon I let it go through a photogate to snag the post explosion velocity and then students completed the calculations.

For the post-lab analysis I threw in a few thinkers. They included:

  • Find the average force on the ball
  • How would a longer cannon change the ball’s launch speed? Explain in terms of impulse-momentum
  • If we used the same cannon but filled the tennis ball with rice, what would happen to the speeds of the ball and cannon post explosion?

You can see a sample student response below:

These questions led to some really great conversations that brought us back to equal forces, equal momentum changes and where time falls into the mix.

Concept Modeling · In My Class Today · Teaching Methods

Multiple Representations for Momentum Conservation

I did it. I finally revised how I teach momentum conservation to my on-track physics students and I’m never looking back!

It can be really hard to shift something that “works” especially if you don’t have a team. For my on-track physics students collision/explosion problems were always an “easy win” for students. We would define that “momentum is conserved” and then talk about how to solve the problems. I would lecture and show them the “table method” and then the “brute force method” and allow them to choose how they wanted to solve.

This was satisfying for students. It felt easy and students gained confidence in physics. However I was always irritated by this. They were performing a series of algorithms to get to an answer with no real understanding of the underlying ideas.

Sometimes we don’t make changes until we are forced to. I had yet to see this part of momentum done in a way that was in alignment with my overall pedagogy and it “worked” …enough. However this year during this particular set of lessons I was to be observed in my classroom. I wanted to ensure that the observation showed who I really am as a teacher, rather than a snapshot of something I had yet to address. So I started digging.

I had seen some work with momentum bar charts around the twitterverse and in Pivot Interactives and in the modeling community, but I wasn’t entirely sold on it. It felt like taking a good idea from energy and forcing it into a place it didn’t need to exist.

I looked to see what Kelly Oshea had done and found her momentum card sort, but I knew that would be too much for an introduction to the content, but it got me thinking.

The following set of four representations is what I settled upon, and here’s how it went:

First, for each of these I would demo the collision first so students had an idea of what was happening before and after the collision. We spend one day on elastic, one on inelastic and one on explosions and for each day we went through several different examples. I’m going to use our final inelastic case for this post.

1 – Draw a picture

There is a reason why “a picture is worth a thousand words”. A picture allows us to easily see and locate information that we might miss in text. For example, in this problem it becomes clear that we have some direction issues, so we know that negatives are going to come into play. For the purposes of my pictures I draw my more massive cars with the added mass on top. You’ll notice I’ve also color coded the larger car as blue.

2 – Momentum Bar Charts

I finally decided to implement the bar charts. For my intro problems I used whole numbers so that we could represent them with tangible “blocks” of momentum. The block width is the mass and the height is the velocity, so in this particular case the total number of blocks is the momentum. I found my students had a hard time shifting this to a more abstract view where you could use area so this will be an emphasis next time.

You’ll notice I’ve brought the color scheme over for the blocks. In class we have already discussed that the total momentum is constant. So we draw the initial case and then we discuss what the final case is going to look like in order to keep momentum constant. Students are able to recognize that we have a total of -3 units of momentum on the initial side, so we need 3 in the final. Since this is an inelastic collision the width has to be three which means the height can only be -1. Students are already solving collision problems without realizing they are doing math! This felt like a really cool win.

3 – Momentum vs time graphs

This part is something I need to think about a little more. It was something that was “obvious” to me, but was very much not obvious to students. To me, it was “obvious” because you just slap those initial and final values on the graph. The hard part, I thought, was ensuring that you are accounting for each car in the inelastic case.

I absolutely LOVE this representation because this is where students can SEE WHY momentum is constant. The CHANGE of each object is the same size, but different in direction! It’s super satisfying!

The challenges my students had came from notions about what it “should” do. Because the cars are moving together, they want the lines to go together at the end. When I recognized this, we spent a day looking at the representations as a whole and locating where momentum is represented in each in order to construct this graph of momentum. There were a lot of “ah ha” moments when we did this. I think next time I will save this graph for last.

4 – Mathematical Model

The tables are no more! With this mathematical model right next to the other representations, student can see where everything is coming from. The momentum terms, the momentum values, and the final velocity value at the end.

While this was definitely a harder task for students to complete, I feel a lot better about their conceptual understanding of what is happening in a collision. The multiple representations also mean that students have multiple ways of showing me that they understand what is happening.

Activities · Teaching Methods

How I Teach… Forces (Intro, the Observational Experiments)

The first set of posts I wrote for this series was about momentum because I made such a large shift from how I used to teach to how I currently teach.

In the same vein my teaching of forces has also changed.

In the past my force unit looked like this:

  1. Inertia Day! Lots of Demos, initiation into the inertia club with club cards (you hold the card on your index finger with a penny on top and figure out how to flick the card out from the penny)
  2. F=ma. Define it, notes, define force diagrams, practice force diagrams. Practice F=ma problems.
  3. One day on action-reaction. Gloss over it; “it’s easy”

I cringe writing this out now. It was so boring! Inertia and action-reaction felt like fluff. We don’t need fluff!

Currently, my unit structure is designed with the big ideas in mind. (Because, tenet 3: Order Matters, Language Matters) I was excited to see that the idea that teaching in a structure that models the thinking we are targetting to improve outcomes is actually supported by research, so my model draws on Lei Bao’s frameworks for force:

One of my biggest frustrations was students putting random “F(applied)” on force diagrams. It irked me to no end!

So starting with the framework for Newton’s Third Law, I turned my force unit on its head. The fundamental piece we begin with is:

A force is an interaction between objects

Observational Experiments

We start with the activity from Pivot Interactives where two cars collide.

Students are asked to separately write what they observe about the car motion and also what they observe about the force acting on each car.

After making the observations we discuss.

The primary aspect students recognize is that heavier/faster cars result in bigger forces. That’s all well annd good, but what about the force that each car experiences. Even though they’ve literally just witnessed and recorded it, they still want the heavier one to hit harder than the light one within the same collision! We closely observe this together and see that, indeed, the forces are always the same.

This is what allows us to define a force as an interaction between objects. Without a second object pushing on the ring, the ring won’t squish. Since the force is something that happens between, it must be equal and opposite.

This very small shift has been a game-changer. It is very rare for me to have students putting totally random forces on objects because “it should have one”.

From here we dive into Eugina Etkina’s ISLE cycle.

Students are asked to hold a heavy and a light object in each hand, palms up and then represent those objects with arrows on a diagram. Students are asked to label each arrow with the object interaction. This is a fun one because a lot of kids are quick to label “gravity” but when I inform them that gravity, is not in fact, an object, they have a moment of pause. Eventually all students arrive at the correct diagrams: equal sized forces on each object, bigger forces on the heavier object.

From here I diverge between AP and regular physics. In regular physics we will go directly to the mass vs weight lab where students will ultimately derive the expression F(earth) = mg. With AP we continue to follow a modeling cycle with experiments with a bowling ball down the hallway: rolling, constant force forward, constant force backward. Then I ask how we could have constant velocity AND constant force. Students are quick to say “push down” (and we are fresh off of projectiles where x and y are independent!). Then realize if we alternate “taps” that will do it (balanced forces). Students are asked to represent and reason by drawing a complete motion map, an accompanying force diagram and then look for patterns. In this way students then recognize that balanced forces will result in constant motion (including v=0) and unbalanced forces result in accelerations. For homework students will complete two exercises from the Active Learning Guide from Etkina’s book where they will continue to practice drawing motion maps and force diagrams together in order to find relevant patterns. From here we get ready for labs!

Up next… labs labs and more labs!
Quantitative Experiments with Forces

In My Class Today · Teaching Methods

Deliberate Practice with Mild, Medium & Spicy Problems

As a high school teacher homework is a constant battle.

At my high school it’s an equity issue. Many of my students lack the time, space and resources to complete homework.

But also, we also know that the fundamental differentiator between excellence and mediocracy is discipline and deliberate practice. And on a very fundamental level “use it or lose it”. So how to ensure practice and ensure it in a way where learning is happening for all students?

Enter Mild, Medium and Spicy questions.

I picked this idea up from Peter Liljidahl when he joined our nationwide physics book study in April on his book Building Thinking Classrooms in Mathematics. He’s been researching this type of practice most recently in classrooms and I was finally ready to give it a try.

I knew that my students needed some extra practice on calculating quantities from kinematic graphs. They just weren’t quite there yet. I could have assigned problems. If I did, I’d get a 25-50% completion rate and mostly students who did not need the practice provided.

Instead, I did the following:

1) I made a variety of position, velocity and acceleration vs time graphs. Mild graphs had one segment, medium had 2 and spicy had 3 or more. Then, I wrote out the solutions to all of the problems. I put the problems up with tape on 3 individual whiteboard for the three flavors. The answers were on a cabinet on the other side of the room

2) We reviewed the previous week’s quiz and identified that this was the area that needed work. I explained to students they could choose the problems, gave them a paper to document their work, and pointed out the answers were provided.

3) I kid you not, I had 100% of students working for 100% of the hour.. to the point where my last class of the day (who normally line up early) were shocked that the bell rang!

Why it works:

1)Taste vs Aptitude Instead of “levels” the questions are sorted by “flavor” there is something psychologically motivating about choosing your preference rather than feeling pigeonholed by ability.

2) Do What you need – give students a task with a number of items and they want to finish as quickly as possible. Alternatively, the task is overwhelming and they don’t even begin. A single graph at a time, that is student selected (hello autonomy!) is manageable. There’s no pressure! No pressure to complete a spicy, no pressure to complete x number of problems. Just do what you need. I had two students go for the spiciest spicy. I made a comment about it and they asked me if they did it correctly if they needed to do more. Ironically, because it was so complex they were going to end up doing 7 different problems in the process anyway!

3) Get to the deep stuff – honestly, the best part of this for me were the conversations I heard students having. Some of them would get into heated arguments about the correct answer, even though they could have just looked. But just looking was like skipping to the end of the movie. The puzzle was more important than the answer. (I’m going to remind folks real quick that this is NOT my AP course)

4) Student Wins – I heard several students comment that day “I feel smart in this class.” and I cannot tell you how big of a statement that is coming from this group of students. If you know, you know.

  • Have any of you tried anything like this?
  • How do you deal with the homework problem?
  • What are you thinking about regarding this idea?
Teaching Methods

Retrieval for Study

I love using retrieval practices.

And while the practice itself is valuable without the need to do more beyond the retrieving act, I really like to add student discourse to the mix.

Today we did retrieval with a homework problem. I’ve also done something similar with notes from class. One of the keys in this activity is color coding.

My students were given an AP problem to work on over the weekend. When they arrived in class today I informed them we were going to discuss the problem but don’t pull it out! I proceeded to give students a blank copy of the problem. Students had 10 minutes to complete the problem using only their brains.

In phase two I had students discuss the problem within their table groups. At the beginning of the year I had put students in groups based on the scores of their cognitive reflection test. Students were initially in mixed groups with the hope that reflective ideas could spread. Unfortunately this backfired a bit as students on the lower end started taking passive roles. For this semester I put similar-scoring students together while also accounting for the personalities I’ve come to know. This means that I knew when I had students talking they were working in similar-ability teams. As students added or changed answers they highlighted the revisions with a highlighter.

For phase three I counted off students in groups of 4 so ideas could spread and mix. Again, students highlighted anything they added or changed with a second color.

Lastly, I went through the solutions formally, but because they had spent so much time on the nitty-gritty I was able to talk about the problem in terms of the big picture. Any lingering revisions needed to be coded in a third color.

When we finished I pointed out that the colors give them an idea of where their studies and focus need to be. Start with the first color: they have lots of resources to help them with those ideas. The second color required a spread of ideas and perhaps had a few more challenging ones in the mix.

Students commented on how they felt more confident about the work we are doing after this activity, and I just love that the paper creates a really clear visual of where they are. The best part is that this paper is just for them. No reason to feel shame because you’re in the middle of the learning process.

Activities · Teaching Methods

How I Teach… Energy Part 4 – Energy Activities!

This is part of a series!
Part 1 (Work) Part 2 (energy bar charts) Part 3 (problem solving)


I have this lab I received from a colleague, it’s an iteration of a lab I’ve seen in other places. Basically an object goes down a ramp, gets caught by a paper catch/index card etc and students are looking for some iteration of work and energy.

In the version I have students are asked to find a relationship between height and distance. The cool thing about this is it ends up that height is directly proportional to distance and related by the coefficient of kinetic friction alone.

Student’s work looks like this:

Students are asked to complete the lab with a hot wheel car and then again with a small mass attached to the car. To students’ surprise the lines are not identical. This really bothers students until we discuss what we were actually looking for. See, the lines are still parallel, but the car with more mass is going to have a greater momentum at the bottom and will require a greater impulse to stop. It’s a fantastic conversation piece.

Student generated graph from lab

I really enjoy this lab because it requires students to consider a new problem and then apply that knowledge to a lab setting. Research has shown that students don’t really learn content in the lab, they learn lab skills. I was always a little frustrated with the disconnect between all of the work students put into the theory and then the lab results themselves. So this time I changed things up.

Instead of giving students the lab hand out and letting them work in groups, when students walked into the room they were put into visibly random groups. Visibly random grouping just means you create the random groups in front of students so they see it was truly random. I’ve been immersed in the book Building Thinking Classrooms and the research on this is really cool.

Once students are in their groups and at a white board that is vertically mounted, I’m in the middle of the room at a lab table with the lab set-up. I verbally explain the set up and that I want them to derive a mathematical model for the relationship between height and distance.

Vertical whiteboarding is really cool and has several advantages. First, students are standing which puts them into a more active position, this gets more of them working. Second, it’s really easy to just look around and snag ideas from other classmates. Third, since they’re already standing it’s really easy to move around the room and discuss with other groups. The first time I did this what astounded me was the sheer number of students talking. Instead of it being maybe 4 or 5 leaders it was nearly everyone in the room! There was so much collaboration and ownership of learning it was magical.

Taking a peek to get ideas is easy!

So I did this with the first part of the lab. Next, I asked them to sketch what the graph will look like with the two lines. Almost all of the students sketched the two lines on top of each other. I want them to have the experience of their data not aligning with their previous ideas and having to reconsider, so we left it at that. Then students were off.

I’m going to finish this lab this week, so I’ll have to come back to update this post, but I love this activity and vertical whiteboarding gets a 10/10 every time.