This is post 2 of 3 on how I (currently) teach momentum in my physics classes.See how I introduce the momentum unit here
you might also like my physics classroom companion worksheets!
In this post I will outline 3 activities I do in my classes. Each serves a different purpose and function depending on the group of students, but most could be used interchangeably between levels depending on your own goals. They are the following:
- Pivot Interactives: Ball on a Wall
- Popper Lab
- Egg Drop Challenge (with a data-driven testing phase)
These activities are all about giving students a “real-world” opportunity to collect data and calculate quantities from the course. There’s not a lot of “discovery” going on here, a primary driver is practice. However, each activity presents rich opportunities for different conversations.
Please don’t steal for profit on TPT. That harms the teachers who share, those who are in need, and our profession as a whole.
Pivot Interactives Activity: Ball Against a Wall (regular level)
Many of us came on to Pivot Interactives after the original library was migrated from “Direct Measurement Videos” many more of us came on to PI when we had to teach in the pandemic. If you can push for a subscription it’s very much worth it. Labs that are too expensive or cumbersome for a class set become attainable, make-up work, homebound, remote learning… you name it. There are a lot of benefits. I love this very simple activity that just involves a ball colliding with a vertical wall. Important note: I don’t use the built-in questions/grading set up in pivot. It’s very well done, but I find that computer work usually hinders collaboration, so I moved away from having students answer in pivot even before the pandemic.
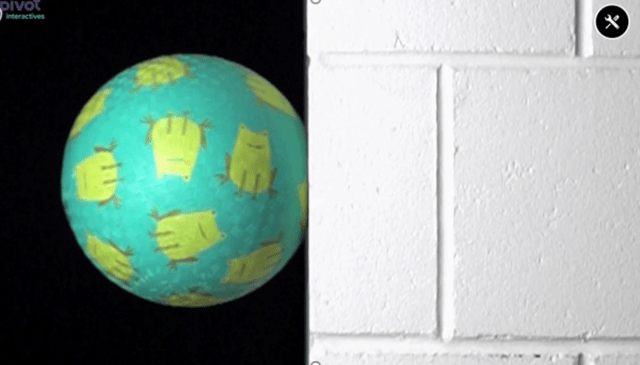
Students begin this activity by reviewing the transformation of F=ma to the impulse-change in momentum relationship. The mass of the ball is provided and students have access to a ruler tool and stopwatch. There are a lot of ways this could be done. For my regular students I have them determine the pre and post collision velocity as a simple x/t calculation (we verify it’s moving constantly by seeing it move equal intervals down the ruler in equal frames). The biggest challenge is determining the time of the collision. This is one thing I love about this activity. In day to day life collisions happen so fast we don’t really consider the impact lasted for a measurable time. I love how this visualizes. You can see my original handout here. Last year I discovered that remote students do better when labs were broken into very small tasks through jamboards, so also check out the jamboard activity here. (2026 Update: Take a look at some of my new summaries for pivot activities!) You will notice a lot of scaffolding. This is necessary for my regular level students, but it may not be for yours. When I run this activity in AP I simply inform them of the goal and send them on their way.
Popper Lab (APP1)
I took this lab from an AP summer institute I attended under the direction of Martha Lietz. Students pop a popper toy (the half-spheres you turn inside out). The ultimate goal is to calculate the time for the “pop”. While students end up using impulse-change in momentum, they also have to use kinematics and F=ma along the way. I find that many students have a hard time with this interleaving because up until this point (remember I do momentum right after forces) we haven’t had too much of a chance to interleave yet. That is one of the main reasons this lab has been a mainstay for me, even if it’s really just a “glorified homework problem” as I tell my students. Students are taken step by step through the process. See the activity here. At the end of the lab I ask students to submit their calculated times to a google form where I aggregate all of the responses. We will first do a quick skim on day 2 so if students calculated an egregious answer, they can obviously see they need to check something. Once we remove the outliers, we do an average and standard deviation. It’s SO COOL to see how close student answers all are when it feels like such an imprecise activity! Because this is a glorified homework problem we can take some time to have a solid conversation about measurement, uncertainty and standard deviations, making it appropriate for AP.
Egg Drop Lab
Whenever students hear we are going to do the egg drop they respond gleefully “we did this in middle school!” I am quick to explain why this is not like middle school and the middle school experience was not like science. In middle school students are typically given tons of supplies, they can use as much as they want and they just cobble whatever together and start chucking. Can you imagine if engineers did this? What a waste of dollars and materials! Besides, you shouldn’t even think about messing with materials unless you have some kind of idea about what is going to happen.
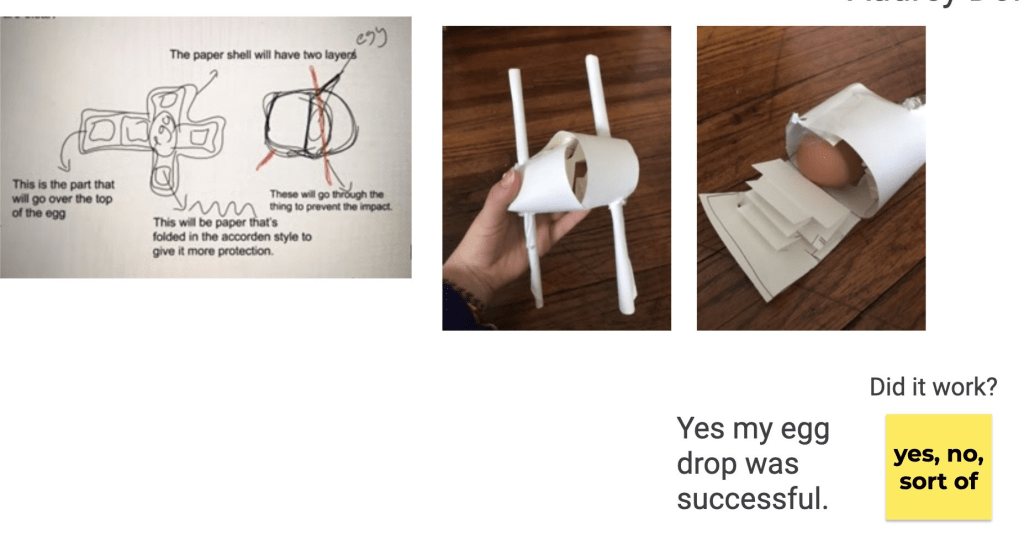
I explain the parameters: 5 sheets of 8.5×11 paper and 1 meter of masking tape. The device must be attached to the egg. No parachutes.
The reason for these parameters is I want students to be thoughtful about the why behind their device.
But no devices are built without prototypes!
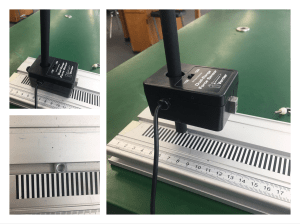
So on day one we have a testing phase. (See handout here) Students use force probes and cars or iOLabs and run “prototypes” into the probe (see image below for how I set up the probe). This might be folder paper, crumpled paper, tubes… whatever! But we know that our eggs will be saved by one thing: increasing the time of impact and decreasing the force.
This activity is by no means precise, but it gets students thinking about what to actually do with the paper.
On drop day students have roughly 35 minutes to build their devices which we drop in the last 15. Students present their devices to their classmates and then drop from 2.0 m. Eye of the Tiger plays on loop in the background.
The following day I ask students to whiteboard diagrams of their devices that also show where the egg was located. We discuss the designs in relation to their smashing or success. View the activity here.
None of these activities are ones I would consider particularly awesome and certainly not flashy, however often its these kinds of activities that allow the nuances to shine.