
At an AP Institute I was introduced to the demonstration where you roll different cans down a ramp and a can of broth is ridiculously fast compared to others. The reason, of course, is that the low viscosity of the broth means the liquid does not spin. In turn the fast majority of the can + contents has translational energy only.

I wanted to do something more with this excersice than “guess which is which”. After some poking around I settled in on this lab that I now run each year. Be forewarned: the results aren’t spectacular, but the lab comes back with great data and a great experience. Students regularly report this is their favorite activity of the year.
We start by laying the foundation of the race. I have 5 cans: An empty can with the lids off, an empty can with lids, refried beans, condensed cream of mushroom soup and chicken broth. I provide students with the following information and ask students to rank by which gets down the fastest.

We share results and comment on similarities. Groups generally predict the empty can without lids will be last, but the rest gets messy. Did students put the refried beans because it was a cylinder or because it has the greatest mass? Where do you put the broth (many throw it in the middle). The cream of mushroom soup has a smaller diameter.. how does that matter? We’ve talked about all of this already, this is a great application.
After our discussion (mass is irrelevant, radius is irrelevant) we talk about modeling each can. The empty cans and the refried beans are obvious: hoops and cylinders. But what about the mushroom soup? When you dump it out you get a cylinder of soup in the pot, so it’s like a hoop + 2 disks + a cylinder of soup. We race the “obvious” ones…empty vs beans, empty + lids vs mushroom soup. Then we race the winners and losers… empty first. I poll the class about the beans and soup. It’s a 50-50 split. I tell them this is a good guess. We have tot race best 2 out of 3. Beans wins by a hair.
Then enter the broth.
After broth is the hands down winner, we talk about what’s happening. What is the liquid DOING? (Many studnets think itt’s spinning like a hoop). I demonstrate with a VOSS bottle and dyed water (VOSS is nice and smooth).
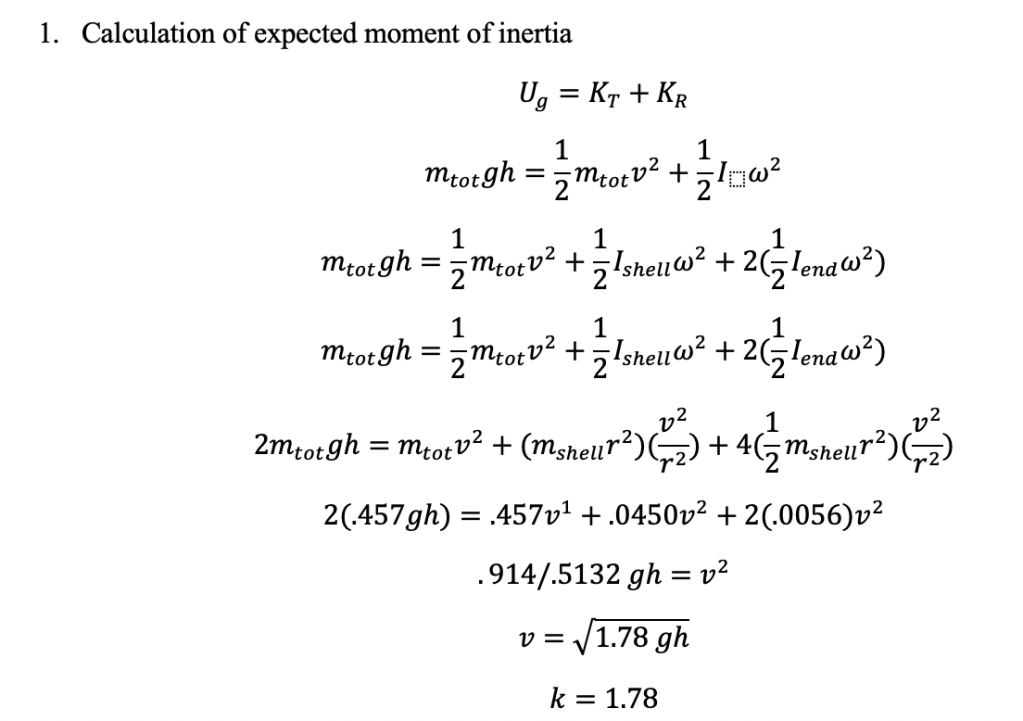
For homework I ask students to develop an expression for ANY object down the ramp. How can we do this? Well one thing worth noting is that every moment of inertia is some object MR². So let’s replace “some number” with k. I tell students they need to figure out the expression and what they will plot to yield a straight line and what the slope will represent.
The next day we review student work. It’s a cool derivation.
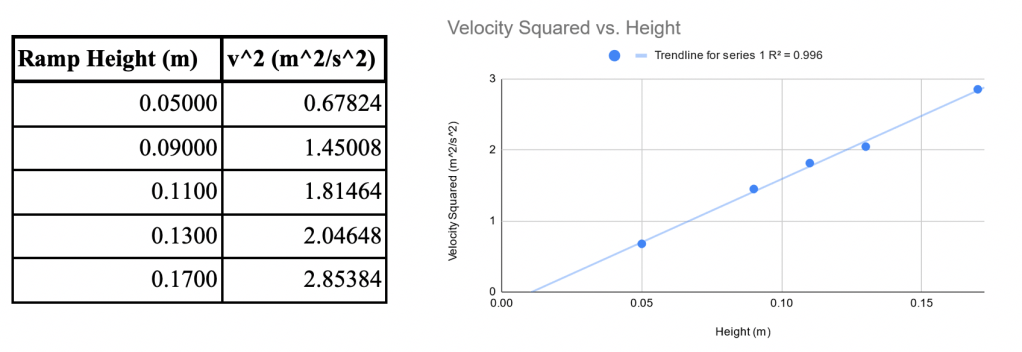
We get down to the fact that students need a graph of v² and height. Ok cool. But how will we compare our results? We go back to the models. Students are responsible for coming up with the velocity at the bottom of the ramp for their assigned can. For this activity I put students in ability-level groups, assigning the empty cans and the beans to the students who are usually C and lower, the broth to my B students and the mushroom soup to my A students. (more on that choice another day). After students have a chance to work through their derivation we review all of them. One of the things we discuss previously is that when determining velocity at the bottom it’s always the √number*g*h and that number is between 1 (hoop) and 2 (sliding only). The numbers we get all fall in line with our expectations and observations…including why mushroom soup and refried beans are such a close call!
Before we begin the lab we need to have a discussion about reducing error. We have a major problem. Height is easy enough to measure with little uncertainty, but we are looking at an expression with final velocity SQUARED. This is problematic for several reasons. First, the square means that uncertainty is going to propagate and blow up. Second, we’re looking for FINAL velocity. Cherry-picking that data point is sure to be messy with tons of uncertainty and, frankly, a waste of our tools. So what IS consistent and reliable no matter what we do? Students quickly realize it’s acceleration! We know how to best collect that data from other labs: run a regression through the position or velocity graph. We can then use a spreadsheet to manually calculate the expected final velocity for a specified distance.
Students are able to get data that generates amazing straight lines and then they use that data to determine the moment of inertial of their cans.
Some of the cans will be pretty far off from the theoretical models, but that’s ok! We tried to really simplify something real and complex! (The original idea from which I got this the activity used cans filled with concrete and other materials that are much closer to the models.)
For the full activity and handouts, I’m sharing here!
Please don’t steal for profit on TPT. That harms the teachers who share, those who are in need, and our profession as a whole.
