At the American Association of Physics Teachers Winter Meeting I had the privilege of presenting in literally the best session of the entire conference (no bias here at all). Magically, all four of our presentations beautifully complimented one another and related deeply to engaging students in metacognitive skills.
I transitioned districts this year. In my previous district I worked with a lot of students in the gifted program, a lot of students in the creative and performing arts program (who are basically also gifted) and within this culture and climate, all kids benefitted, even the ones who were not in a special program. For years I was able to get students on board with the Expert Game, and the Science of Learning Physics some trust in the process, and good relationships. This year, that hasn’t quite cut it. I’d been thinking about a way to somehow “teach” students in a way that feel like “teaching” to them about how to learn, study and grow so they might buy into the idea (which is really nothing new).
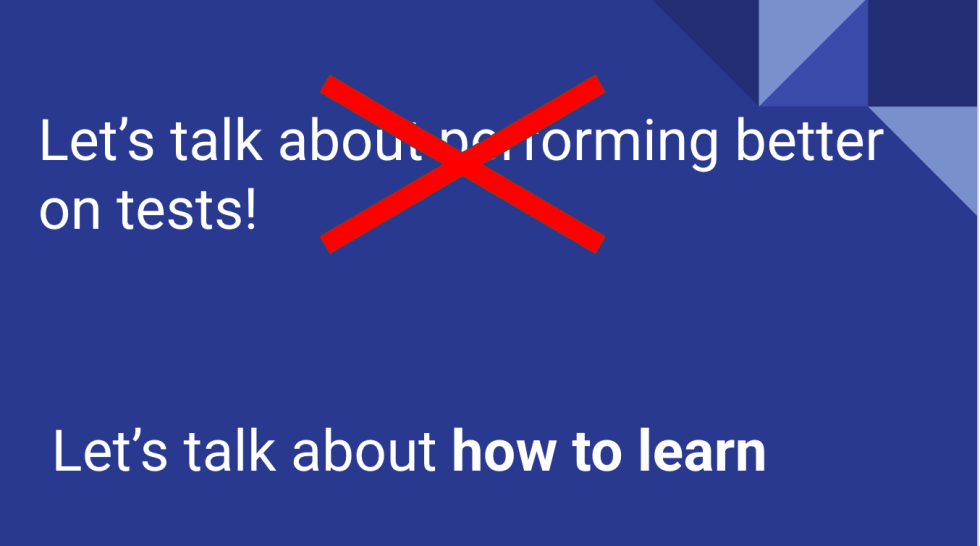
I had been digging back into Powerful Teaching and some kind of workshop was begining to materialize, albeit very, very fuzzy. And then, at Winter Meeting, Aaron Titus gets up and shares that he offers a “How to Do Better on the Test” workshop which turns out to be “How to Learn”
The workshop is grounded in the work of Dr. Saundra McGuire. There are a lot of resources of hers around the web, like this lecture here on metacognition, but primarily she has a sweet little book called Teach Yourself How to Learn. It’s short, sweet, to the point and a lot of fun to read. Dr. McGuire is a retired chemistry professor and Director Emerita of the Center for Academic Success. She is also an awardee of the Presidential Award for Excellence in Math and Science Mentorship.
Immediately in chapter one she discusses one of the aspects about college that is hardest for students: getting As and Bs in high school often comes down to memorization and regurgitation. Now, before you come with fire I know that many of us (especially if we teach AP, and definitely if you enjoy my blog) are making students do incredible things. But I also know that you can probably name more than a handful of colleagues who don’t push their students beyond memorization. Teachers who produce study guides that are basically a carbon copy of the exam. Exams that are almost all multiple choice and the math is strictly plug and chug. The dreaded triangle to “support” students doing equations like F=ma. And if not the teachers themselves, some really great high school students simply don’t get pushed beyond needing to simply show up to class to learn the information. They can get away with minimal to no homework and no studying and still do okay in the class because we see them every single day and they work hard in our rooms.
So the workshop starts by introducing students to Bloom’s Taxonomy and we have a conversation about what level they are operating at most of the time, compared to what level they need to operate at for AP Physics. What level do they think they need to operate at in college?
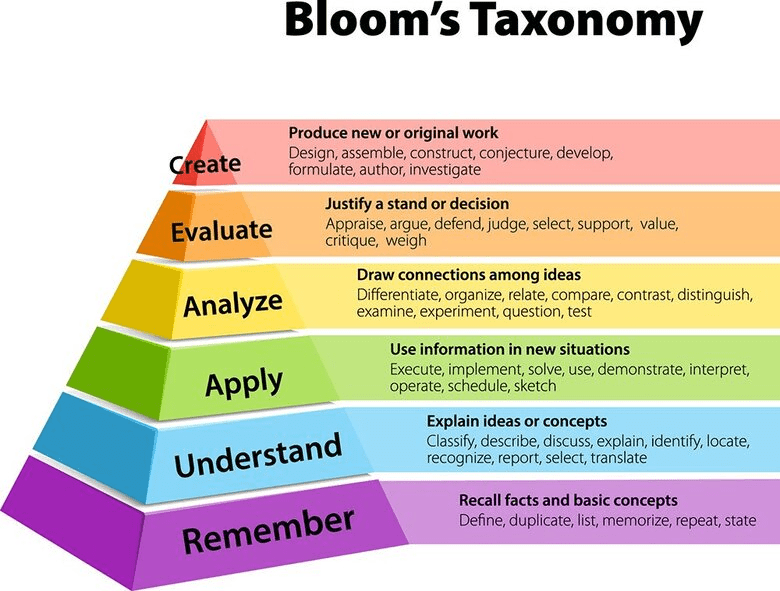
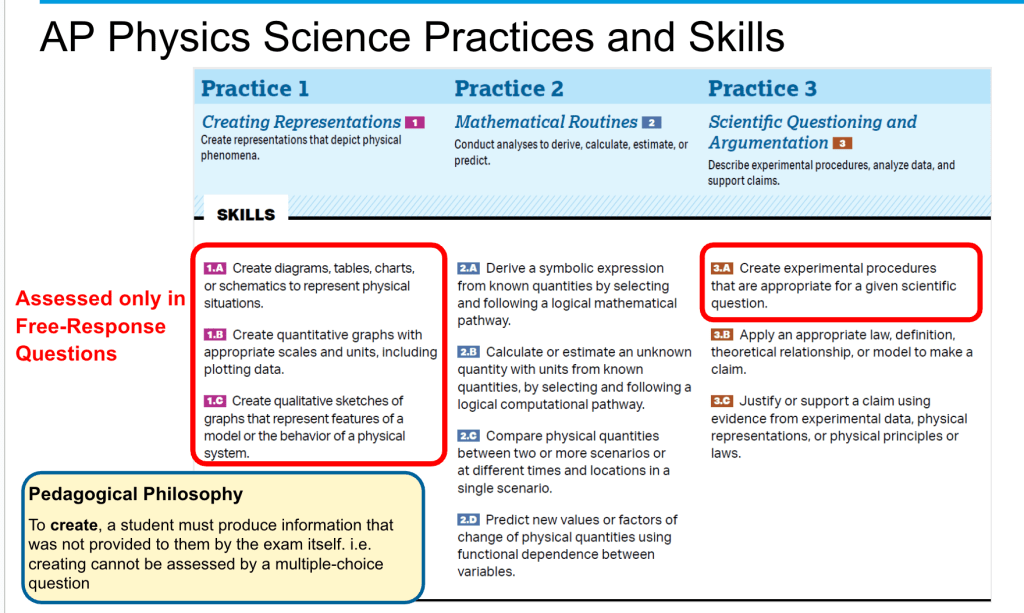
And sure enough, if you pull up the science practices and skills for AP the word “create” is literally all over the place. The top of the pyramid.
From here we took a look at a recent exam question. First I asked them a simple question:
Which of the following is true about work?
- Work is effort
- Work is a change in energy
- Work is a force
They all know the answer. And this is a recall answer.
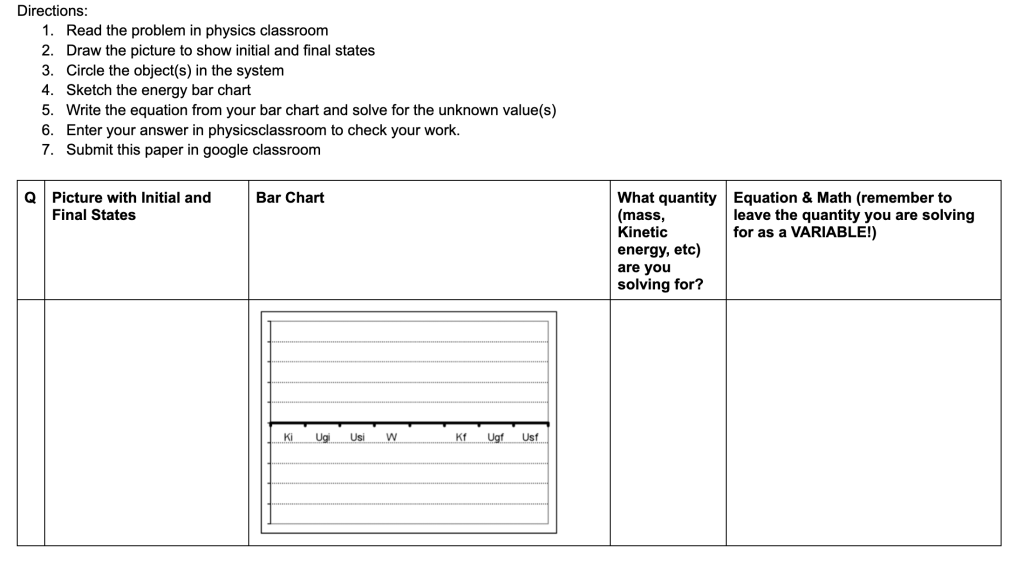
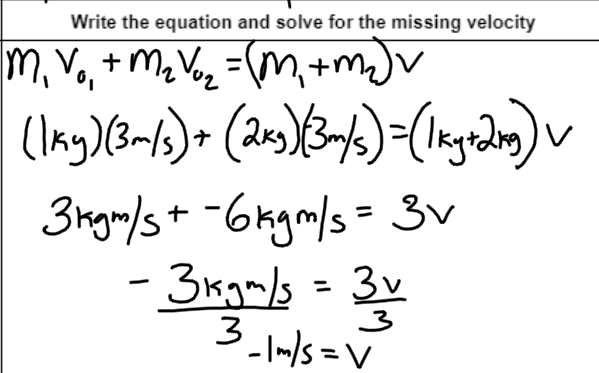
Then I showed them the exam question (they did really poorly on). While the question fundamentally was about the fact that work is a change in energy, what they were asked to do was apply the concept of taking an integral to calculate work and then create a graphical representation.
From here we discussed the differences between studying and learning and posed the question, “which would you work harder for? To study to get an A on a test, or prepare to teach the material to the class?”
The latter half of the workshop is about sharing strategies for doing homework, reading the text, and using practice exams. (You can find all of these in Dr. McGuire’s work and resources!)
I summarized some of these along with my personal favorites into the following list:
- When you get home from school, write down everything you can remember from class that day, then compare with your class notes to identify/fill the gaps
- Did you solve some problems? Grab a clean sheet of paper and solve the problem again. Compare to the example and make notes regarding your forgetting/gaps
- Create a concept map to tie together big ideas and conceptual details
- Make “teacher notes” as if you were preparing to teach the material
- Aim for 100% mastery when you sit to study, not 85-90
As we wrapped up, the most important part of this workshop was asking students to make a commitment to do something different in the next 24 hours. I had students submit these along with some additional reflections. There were two that stood out to me today. One student reflected, “The reason this class is so challenging for me is because I haven’t had a class besides maybe Calc that required me to be at that creating level.”
A second student made an observation that knocked me over in joy:
“Physics is more than just who is smarter and has the ability to think at a higher level.”
And with that, I’m signing off. I’m going to attach my version of the slides, but everything is very much thanks to the work of Aaron Titus and Saundra McGuire.


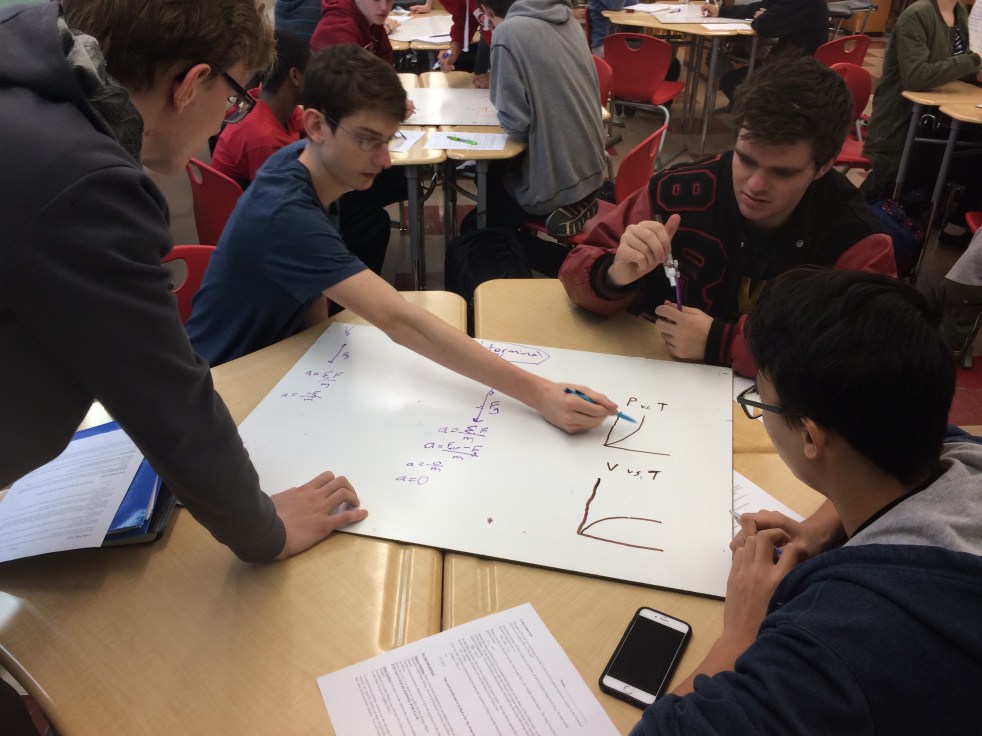
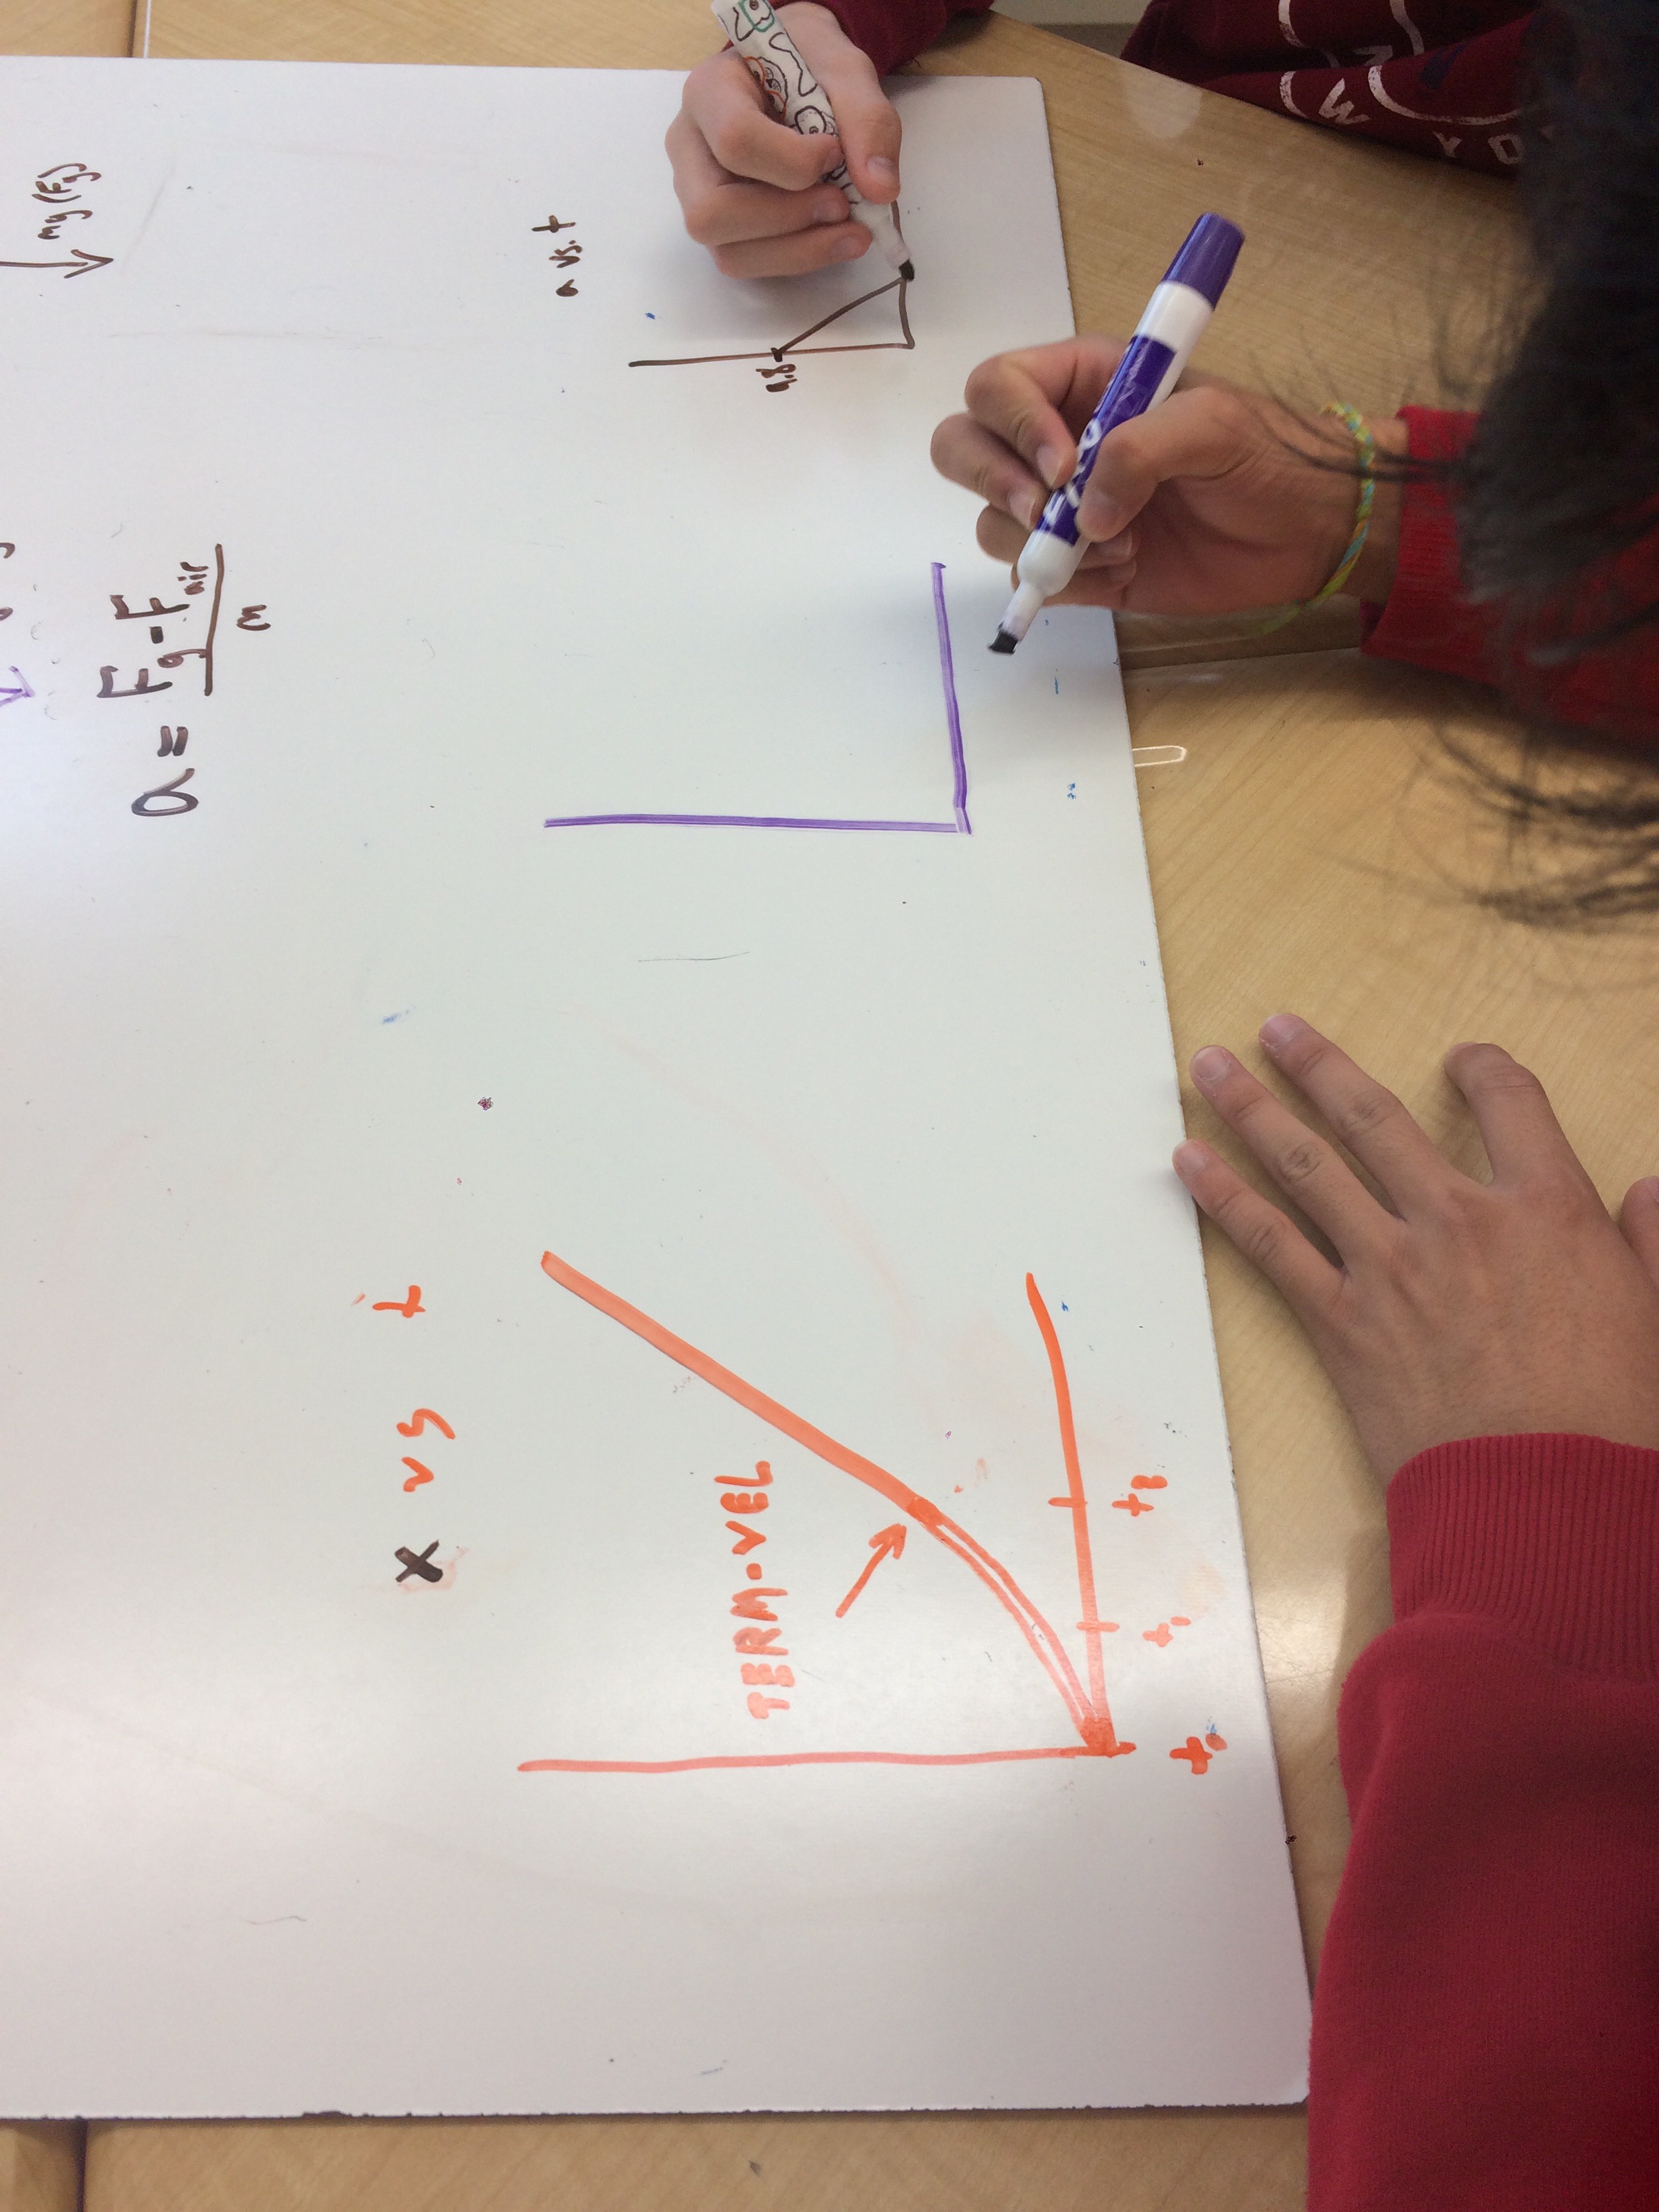
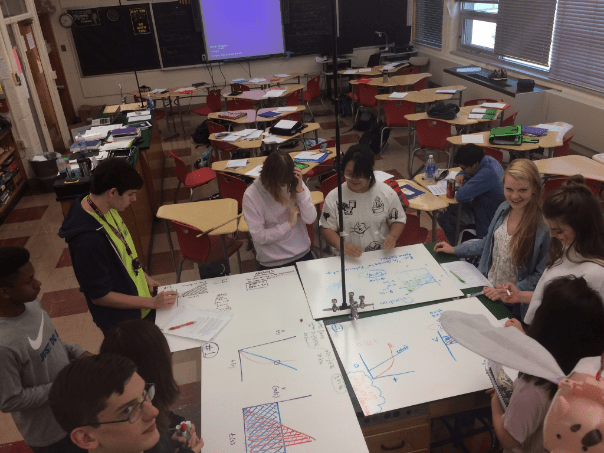
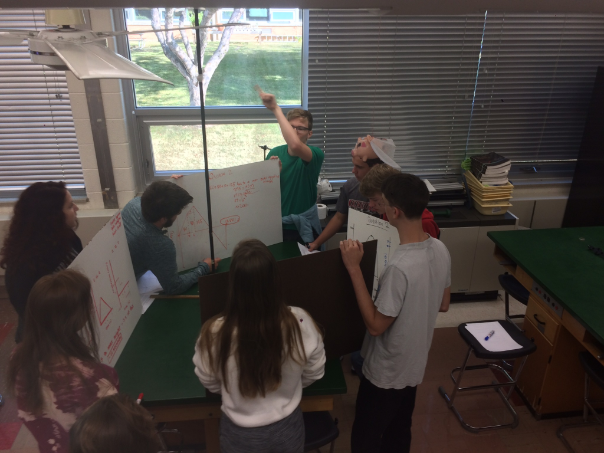
 It was so cool to watch them work, discuss and argue. The FBD’s were relatively easy, the discussions mostly about whether or not to put air resistance on the t=0 diagram.