Concept Modeling · In My Class Today · Teaching Methods

Multiple Representations for Momentum Conservation

I did it. I finally revised how I teach momentum conservation to my on-track physics students and I’m never looking back!

It can be really hard to shift something that “works” especially if you don’t have a team. For my on-track physics students collision/explosion problems were always an “easy win” for students. We would define that “momentum is conserved” and then talk about how to solve the problems. I would lecture and show them the “table method” and then the “brute force method” and allow them to choose how they wanted to solve.

This was satisfying for students. It felt easy and students gained confidence in physics. However I was always irritated by this. They were performing a series of algorithms to get to an answer with no real understanding of the underlying ideas.

Sometimes we don’t make changes until we are forced to. I had yet to see this part of momentum done in a way that was in alignment with my overall pedagogy and it “worked” …enough. However this year during this particular set of lessons I was to be observed in my classroom. I wanted to ensure that the observation showed who I really am as a teacher, rather than a snapshot of something I had yet to address. So I started digging.

I had seen some work with momentum bar charts around the twitterverse and in Pivot Interactives and in the modeling community, but I wasn’t entirely sold on it. It felt like taking a good idea from energy and forcing it into a place it didn’t need to exist.

I looked to see what Kelly Oshea had done and found her momentum card sort, but I knew that would be too much for an introduction to the content, but it got me thinking.

The following set of four representations is what I settled upon, and here’s how it went:

First, for each of these I would demo the collision first so students had an idea of what was happening before and after the collision. We spend one day on elastic, one on inelastic and one on explosions and for each day we went through several different examples. I’m going to use our final inelastic case for this post.

1 – Draw a picture

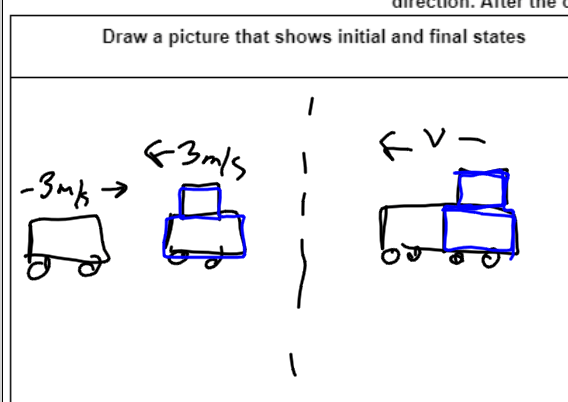
There is a reason why “a picture is worth a thousand words”. A picture allows us to easily see and locate information that we might miss in text. For example, in this problem it becomes clear that we have some direction issues, so we know that negatives are going to come into play. For the purposes of my pictures I draw my more massive cars with the added mass on top. You’ll notice I’ve also color coded the larger car as blue.

2 – Momentum Bar Charts

I finally decided to implement the bar charts. For my intro problems I used whole numbers so that we could represent them with tangible “blocks” of momentum. The block width is the mass and the height is the velocity, so in this particular case the total number of blocks is the momentum. I found my students had a hard time shifting this to a more abstract view where you could use area so this will be an emphasis next time.

You’ll notice I’ve brought the color scheme over for the blocks. In class we have already discussed that the total momentum is constant. So we draw the initial case and then we discuss what the final case is going to look like in order to keep momentum constant. Students are able to recognize that we have a total of -3 units of momentum on the initial side, so we need 3 in the final. Since this is an inelastic collision the width has to be three which means the height can only be -1. Students are already solving collision problems without realizing they are doing math! This felt like a really cool win.

3 – Momentum vs time graphs

This part is something I need to think about a little more. It was something that was “obvious” to me, but was very much not obvious to students. To me, it was “obvious” because you just slap those initial and final values on the graph. The hard part, I thought, was ensuring that you are accounting for each car in the inelastic case.

I absolutely LOVE this representation because this is where students can SEE WHY momentum is constant. The CHANGE of each object is the same size, but different in direction! It’s super satisfying!

The challenges my students had came from notions about what it “should” do. Because the cars are moving together, they want the lines to go together at the end. When I recognized this, we spent a day looking at the representations as a whole and locating where momentum is represented in each in order to construct this graph of momentum. There were a lot of “ah ha” moments when we did this. I think next time I will save this graph for last.

4 – Mathematical Model

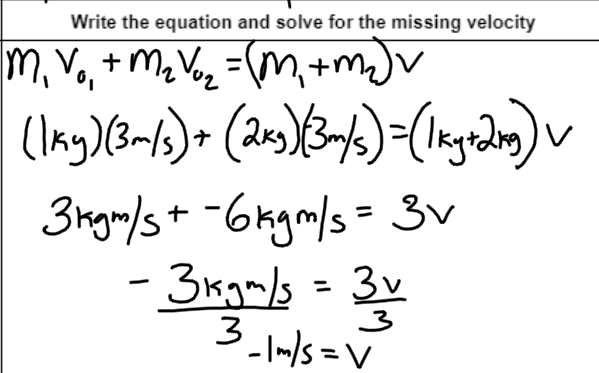
The tables are no more! With this mathematical model right next to the other representations, student can see where everything is coming from. The momentum terms, the momentum values, and the final velocity value at the end.

While this was definitely a harder task for students to complete, I feel a lot better about their conceptual understanding of what is happening in a collision. The multiple representations also mean that students have multiple ways of showing me that they understand what is happening.

Teaching Methods

How I Teach… Forces (Intro, the Observational Experiments)

The first set of posts I wrote for this series was about momentum because I made such a large shift from how I used to teach to how I currently teach.

In the same vein my teaching of forces has also changed.

In the past my force unit looked like this:

  1. Inertia Day! Lots of Demos, initiation into the inertia club with club cards (you hold the card on your index finger with a penny on top and figure out how to flick the card out from the penny)
  2. F=ma. Define it, notes, define force diagrams, practice force diagrams. Practice F=ma problems.
  3. One day on action-reaction. Gloss over it; “it’s easy”

I cringe writing this out now. It was so boring! Inertia and action-reaction felt like fluff. We don’t need fluff!

Currently, my unit structure is designed with the big ideas in mind. (Because, tenet 3: Order Matters, Language Matters) I was excited to see that the idea that teaching in a structure that models the thinking we are targetting to improve outcomes is actually supported by research, so my model draws on Lei Bao’s frameworks for force:

One of my biggest frustrations was students putting random “F(applied)” on force diagrams. It irked me to no end!

So starting with the framework for Newton’s Third Law, I turned my force unit on its head. The fundamental piece we begin with is:

A force is an interaction between objects

Observational Experiments

We start with the activity from Pivot Interactives where two cars collide.

Students are asked to separately write what they observe about the car motion and also what they observe about the force acting on each car.

After making the observations we discuss.

The primary aspect students recognize is that heavier/faster cars result in bigger forces. That’s all well annd good, but what about the force that each car experiences. Even though they’ve literally just witnessed and recorded it, they still want the heavier one to hit harder than the light one within the same collision! We closely observe this together and see that, indeed, the forces are always the same.

This is what allows us to define a force as an interaction between objects. Without a second object pushing on the ring, the ring won’t squish. Since the force is something that happens between, it must be equal and opposite.

This very small shift has been a game-changer. It is very rare for me to have students putting totally random forces on objects because “it should have one”.

From here we dive into Eugina Etkina’s ISLE cycle.

Students are asked to hold a heavy and a light object in each hand, palms up and then represent those objects with arrows on a diagram. Students are asked to label each arrow with the object interaction. This is a fun one because a lot of kids are quick to label “gravity” but when I inform them that gravity, is not in fact, an object, they have a moment of pause. Eventually all students arrive at the correct diagrams: equal sized forces on each object, bigger forces on the heavier object.

From here I diverge between AP and regular physics. In regular physics we will go directly to the mass vs weight lab where students will ultimately derive the expression F(earth) = mg. With AP we continue to follow a modeling cycle with experiments with a bowling ball down the hallway: rolling, constant force forward, constant force backward. Then I ask how we could have constant velocity AND constant force. Students are quick to say “push down” (and we are fresh off of projectiles where x and y are independent!). Then realize if we alternate “taps” that will do it (balanced forces). Students are asked to represent and reason by drawing a complete motion map, an accompanying force diagram and then look for patterns. In this way students then recognize that balanced forces will result in constant motion (including v=0) and unbalanced forces result in accelerations. For homework students will complete two exercises from the Active Learning Guide from Etkina’s book where they will continue to practice drawing motion maps and force diagrams together in order to find relevant patterns. From here we get ready for labs!

Up next… labs labs and more labs!
Quantitative Experiments with Forces

In My Class Today · Teaching Methods

Deliberate Practice with Mild, Medium & Spicy Problems

As a high school teacher homework is a constant battle.

At my high school it’s an equity issue. Many of my students lack the time, space and resources to complete homework.

But also, we also know that the fundamental differentiator between excellence and mediocracy is discipline and deliberate practice. And on a very fundamental level “use it or lose it”. So how to ensure practice and ensure it in a way where learning is happening for all students?

Enter Mild, Medium and Spicy questions.

I picked this idea up from Peter Liljidahl when he joined our nationwide physics book study in April on his book Building Thinking Classrooms in Mathematics. He’s been researching this type of practice most recently in classrooms and I was finally ready to give it a try.

I knew that my students needed some extra practice on calculating quantities from kinematic graphs. They just weren’t quite there yet. I could have assigned problems. If I did, I’d get a 25-50% completion rate and mostly students who did not need the practice provided.

Instead, I did the following:

1) I made a variety of position, velocity and acceleration vs time graphs. Mild graphs had one segment, medium had 2 and spicy had 3 or more. Then, I wrote out the solutions to all of the problems. I put the problems up with tape on 3 individual whiteboard for the three flavors. The answers were on a cabinet on the other side of the room

2) We reviewed the previous week’s quiz and identified that this was the area that needed work. I explained to students they could choose the problems, gave them a paper to document their work, and pointed out the answers were provided.

3) I kid you not, I had 100% of students working for 100% of the hour.. to the point where my last class of the day (who normally line up early) were shocked that the bell rang!

Why it works:

1)Taste vs Aptitude Instead of “levels” the questions are sorted by “flavor” there is something psychologically motivating about choosing your preference rather than feeling pigeonholed by ability.

2) Do What you need – give students a task with a number of items and they want to finish as quickly as possible. Alternatively, the task is overwhelming and they don’t even begin. A single graph at a time, that is student selected (hello autonomy!) is manageable. There’s no pressure! No pressure to complete a spicy, no pressure to complete x number of problems. Just do what you need. I had two students go for the spiciest spicy. I made a comment about it and they asked me if they did it correctly if they needed to do more. Ironically, because it was so complex they were going to end up doing 7 different problems in the process anyway!

3) Get to the deep stuff – honestly, the best part of this for me were the conversations I heard students having. Some of them would get into heated arguments about the correct answer, even though they could have just looked. But just looking was like skipping to the end of the movie. The puzzle was more important than the answer. (I’m going to remind folks real quick that this is NOT my AP course)

4) Student Wins – I heard several students comment that day “I feel smart in this class.” and I cannot tell you how big of a statement that is coming from this group of students. If you know, you know.

  • Have any of you tried anything like this?
  • How do you deal with the homework problem?
  • What are you thinking about regarding this idea?
In My Class Today · Teaching Methods

Day 2: Thinking about Relationships

Day 1 I run a HUGE physics smorgy: 11-15 demos/lab set ups with minimal directions. Students are told to play, investigate, explore, PAY ATTENTION and ask lots of questions. This is my hook into the class for the year. I’m able to observe the students, act ridiculous and ease the MASSIVE anxiety they walk into this class with.

The next four days we actually spend working with data and relationships. Specifically to build the skills necessary to analyze data on a graph and straighten it when needed. I have a reading I ask students to do ahead of time and then we go through the straightening process. These brilliant students (half of whom are in AP Calc) are completely flabbergasted by the straightening process. It just doesn’t. make. sense to them.

I decided to try something different today on the fly, and it brought about some great conversations. First I put up blank sketches of graphs depicting a linear, squared, inverse and square root function. I asked them to put the graphs on their white boards and write the relationships. The answers consisted of the following:

  • “linear, squared, inverse and square root”
  • y=x, y=x^2 (etc)
  • y∝x y∝x^2 (etc)

This kicked off some great conversations. Are we in agreement, generally, about which is which? (yes). Are the equations really representative of the sketches? (We don’t know, there are no labels or numbers on the axes)

Next, I gave students four statements

  1. “Momentum is proportional to velocity”
  2. “A spring loaded gun is fired upward. The height of the bullet is proportional to the compression squared”
  3. “Velocity is inversely proportional to mass”
  4. “The period squared is proportional to the length of a simple pendulum”

I asked them to label the axes of their graphs with the physical quantities to match the statements. Here’s where the fun began. Students took a lot longer than I had originally anticipated completing this task. Here were the great conversations to be had:

  • In science, we usually put the independent and dependent variables on the x and y axis. With these statements, is it obvious which is which?
  • Since it’s not obvious, are answers where the axis are flipped wrong? (Not if they picked the appropriate shape!)
  • So, we often are going to use slope to talk about relationships. Like, say, if we plotted distance on the y and time on the x what would we get? (speed…minds are blown)  The cool thing is if you plot the graph “wrong” you can look at the units,  and decide if they need to flip because you’d have seconds per meter or something. The important thing is whatever you tell me the relationship is, needs to match your graph.
  • Then, of course, I let them in on the secret: we always list the y thing first. Literally all we are doing in these sentences is taking the math proportions, like y∝x^2 and saying, instead, height ∝ compression^2. It’s like the hugest lightbulb moment for students ever.

Now that they have that substitution thing in their brain, explaining how to straighten graphs is a snap. I was really pleased with the lack of frustrated and confused faces. Last year, I sadly, lost several kids during this unit. I wanted to cry so hard because we hadn’t even started physics and seriously questioned my lesson plans.

Tomorrow they finish their pendulum labs, so we’ll see how this all goes.

Meanwhile, AP Physics C is dabbling in computational physics for kinematics. More on that later.


Teaching Methods

Modeling vs Intentional Modeling

“I use modeling, do you?”
“Uh…no, but I’m interested in learning about it”

I felt like such a noob when I had this conversation a few months ago because literally, everyone else at my group seemed to be doing this already. I was at a workshop on whiteboarding after a talk on standards-based grading and modeling and I thought, “wow, she really has it together… I have a LOT of work to do” (Does anyone else have this overwhelming feeling of inadequacy in the classroom all. the. time. or is it just the mom-guilt extended into the classroom?)

So I have started incorporating some things here and there as I’ve gone along, and I recently looked into Etkina’s resources (I started using parts of her book last year). As I poured over Etkina’s labs and our workshop speaker’s resources I realized: I HAVE BEEN DOING MODELING ALL ALONG! Mostly because it’s just the way I already think about problems. It just didn’t have a fancy name, and more importantly, I wasn’t always doing it intentionally as a teaching strategy.

I’ve decided that the intention is really the key in modeling as a teaching strategy. I think good physicists are good at models but bad at teaching them. We do it so seamlessly in our own work we fail to realize that type of thinking is not seamless or natural to the general public.

Cue modeling curriculum

Models are just any representation we use for a situation: pictures, free body diagrams, motion diagrams, graphs, mathematics etc. We need to work our kids like gymnasts, very intentionally using and practicing these models so that our students become flexible and natural at using them on their own for any scenario.

This is the paradigm shift: teach the model first, and the physics as a result of the model. Too often physics teachers (especially physics teachers not trained in physics) teach all this physics stuff, then all these equations for particular problems and then maybe shove in some graphs at the end. The problem is that students fail to see the bigger picture and physics becomes a class where students are attempting to memorize a million procedure for a million different problems, rather than learning a handful of approaches and selecting the best one or two for the problem at hand. The clearest example of this in my current classroom is how I am teaching two-body problems. I have made a huge deal about the fact that all of the physics is in the FBD. Because learning the general process for FBDs is a lot easier than trying to memorize separate processes for ramps, Atwood machines, modified atwood’s and oops! Now there’s friction!

The next most important part of this is to teach students how to communicate with one another using their models, and this is where the value of whiteboarding comes into play. I believe very strongly in letting the kids move around the room to see whiteboards without having a board representative at each board. The reason for this is that the students begin to realize that it’s hard to make sense of what someone has done if you don’t provide enough detail. Students can then ask these questions and leave them at the board before we come together as a whole group for discussion.

I decided to use modeling very intentionally in the classic coffee-filter air resistance lab. The original lab I had snagged from someone had a bunch of background info and then asked students to skets the velocity and acceleration graphs. I got really tired of marking the same things on everyone’s papers last year and realized this year that this is a perfect opportunity for modeling.

When students walked in today their desks were in groups of four with a whiteboard. I asked them for the following

  1. A free body diagram at t=0, sometime before terminal velocity, and at terminal velocity
  2. Acceleration expressions for each of the diagrams
  3. position, velocity and acceleration vs time graphs.

IMG_1632
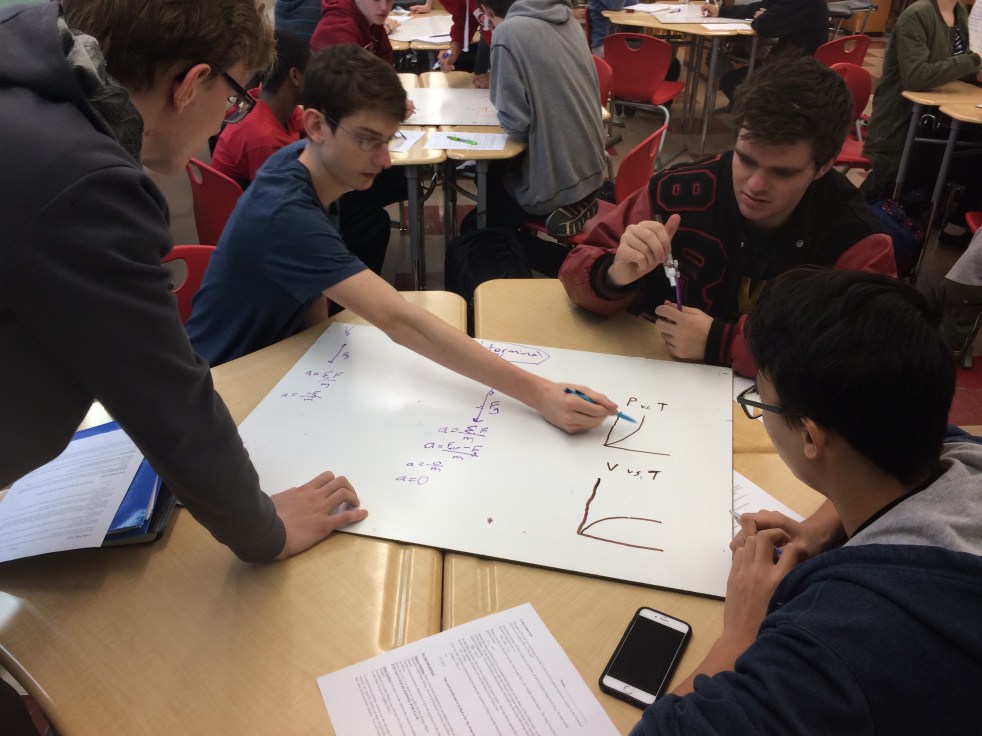
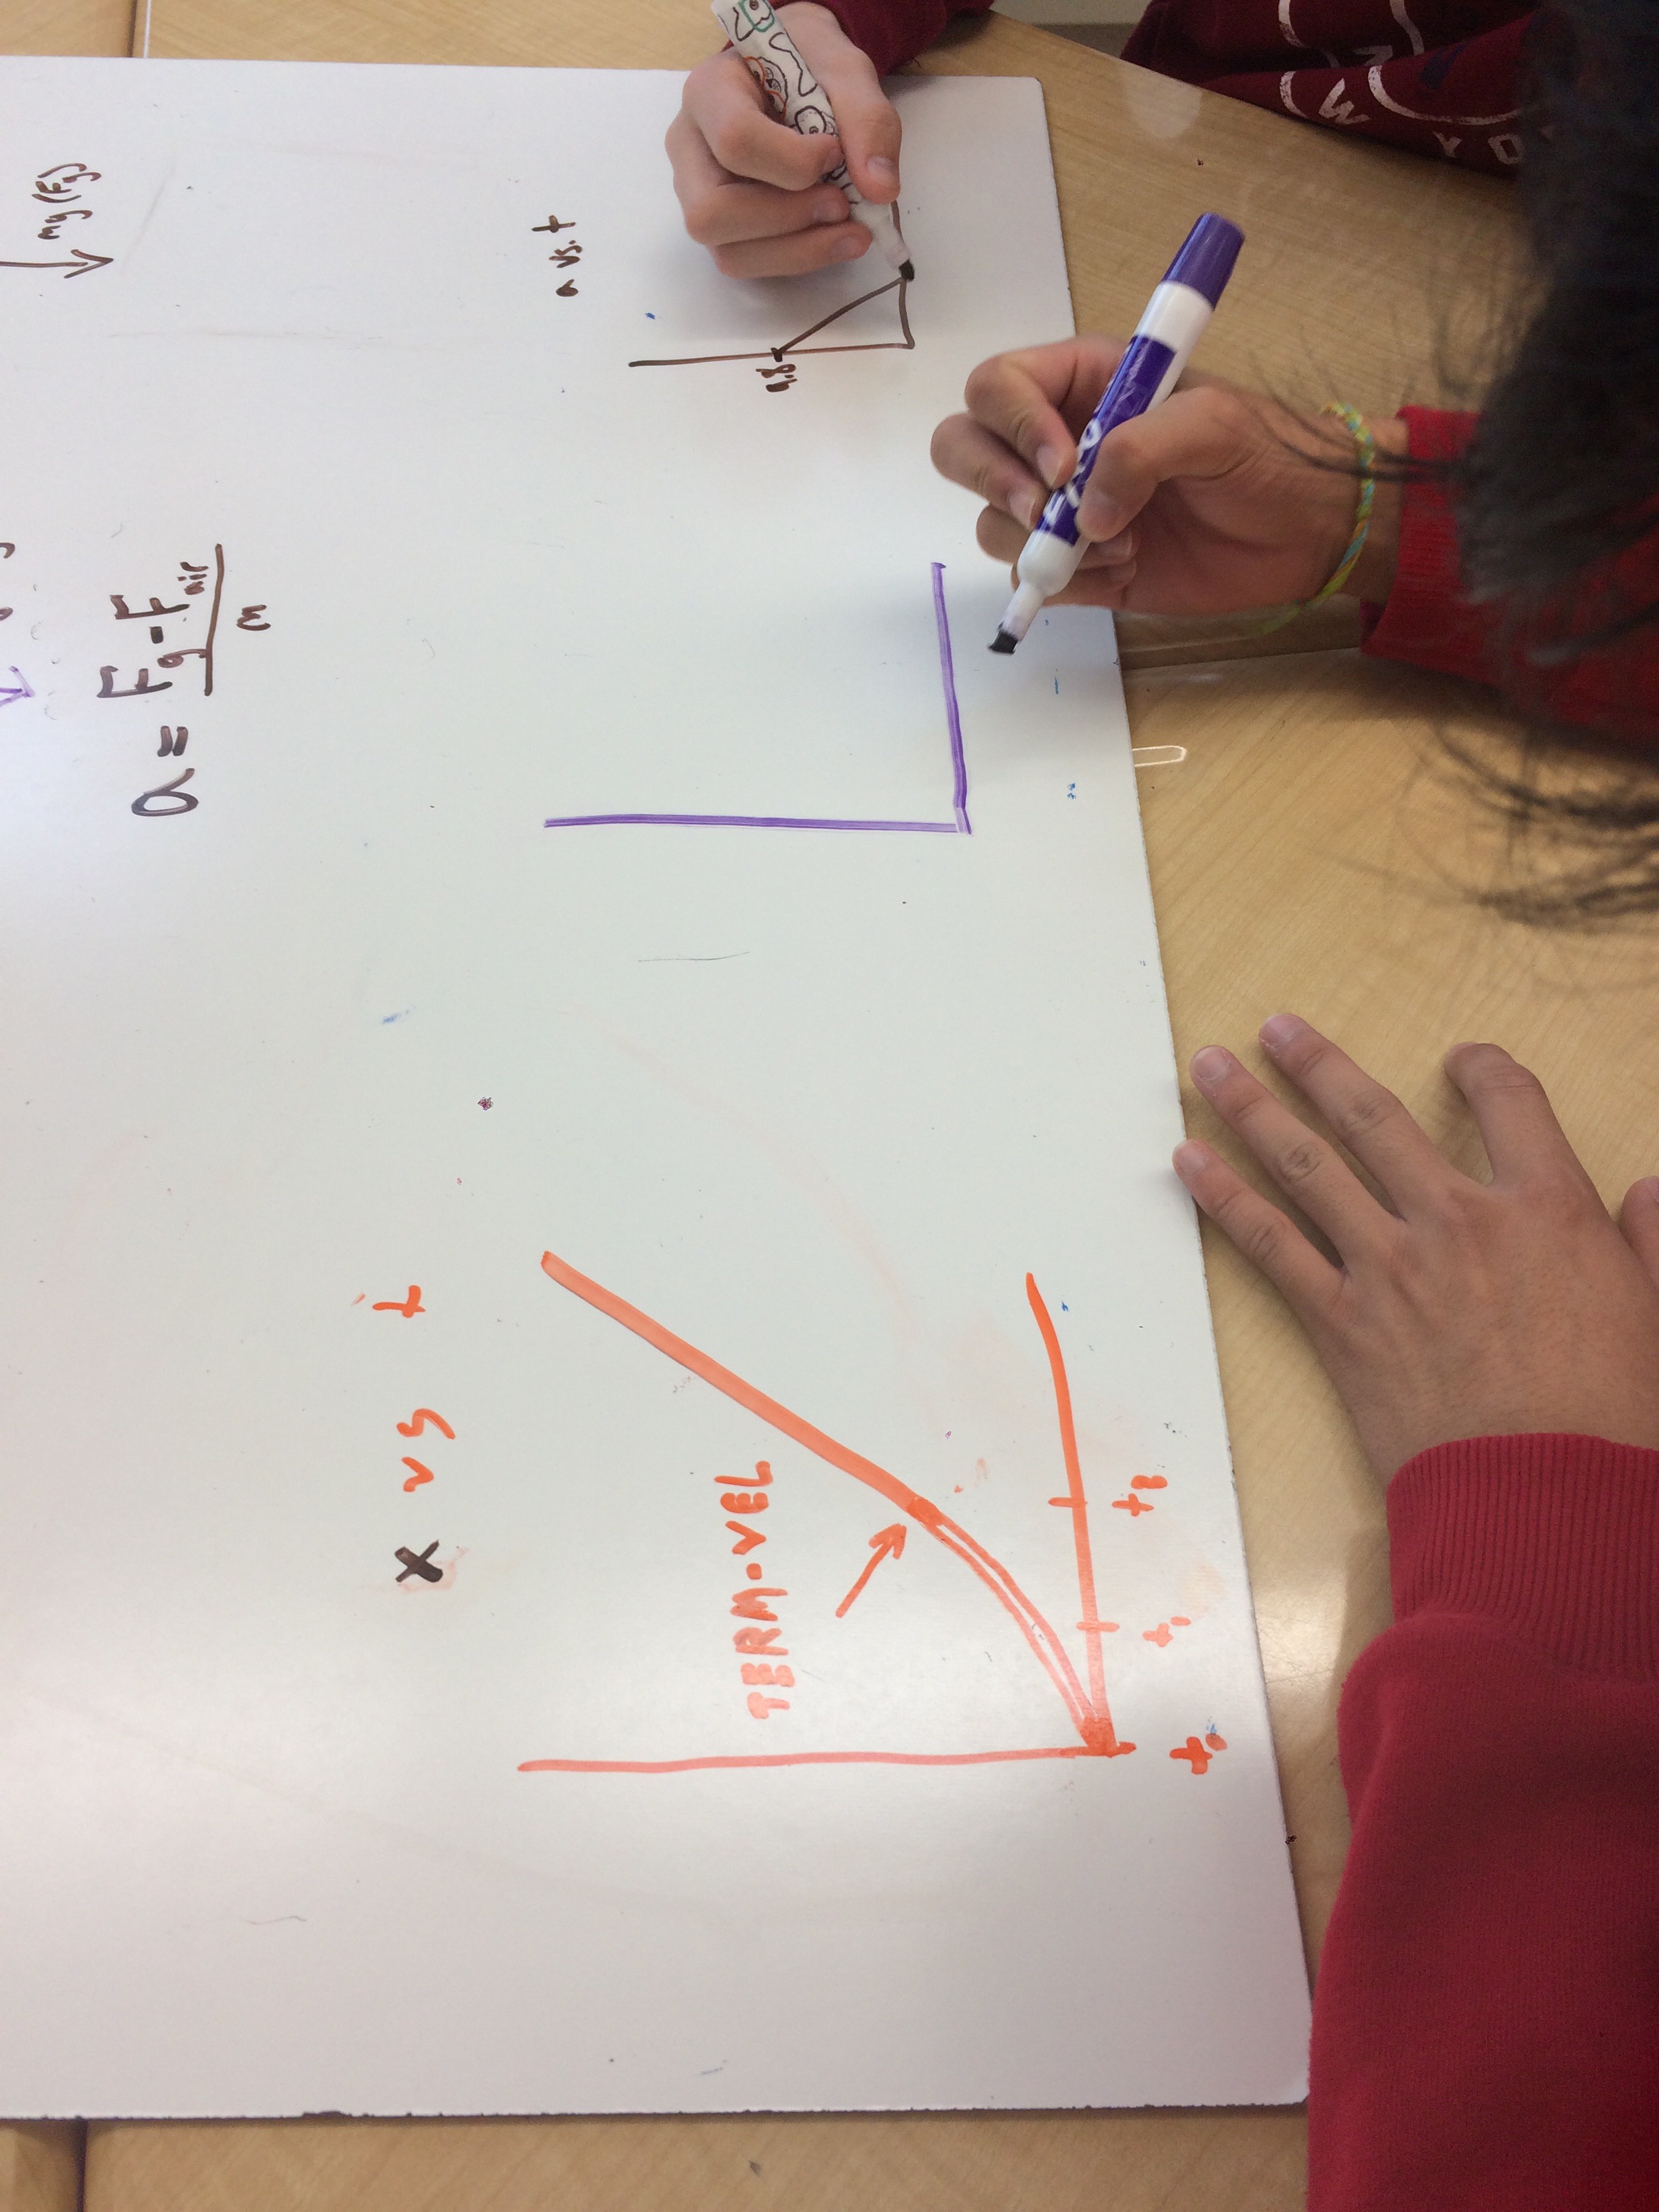
It was so cool to watch them work, discuss and argue. The FBD’s were relatively easy, the discussions mostly about whether or not to put air resistance on the t=0 diagram.

The discussions about the graphs were far more interesting. Many students were working with the graphs as unique units, rather than considering the relationships from one to the next. Inevitably we had piecewise acceleration graphs and linear acceleration graphs and linear piece-wise vs curved velocity graphs.

IMG_1633


I asked the kids to cite similarities and ask questions about differences. One group today started changing their board before attention was drawn to them. It offered a fantastic opportunity to review the graph models and review the relationships.

One of my favorites was a group that decided the curve of the velocity graph was quadratic, so they started taking the antiderivative for the position function. They noticed the constant slope portion in many of the other graphs and asked the question about it. Then they realized (#overachievers) the velocity graph wasn’t really quadratic.

I realize this particular example isn’t quite model-based learning through and through as I did not allow them to experimentally discover the exponential function relationships, rather after discussing that all of these changes were continuous I gave them a brief taste of the calculus/diff eqs ending in “solution is always in the form….” and hey, doesn’t that look like the curve we agreed upon?

We only collected data today, so I’m really curious and excited for what their write-ups are going to look like Wednesday!

I’ll keep you posted 🙂


Teaching Methods · Uncategorized

Teaching to Reach the Introvert

My second-grade teacher called my mom concerned that I didn’t play with any of the kids at recess: I read a book under a tree instead. When my mom asked if this was a problem the teacher reported that I wouldn’t have any friends. I was elected to represent our class for the school council that year.

Research indicates that as much as 50-74% of the population is extroverted. It is generally viewed as a valued quality: put yourself out there, be friendly, be social. These are the rules society dictates whether it is on the elementary playground or in the workplace. Our culture favors extroversion, and many of the qualities associated with introversion are erroneously viewed as a failure to be able to advocate and insecurities with oneself.

Nowhere does extroversion seem to get a higher reward than in the classroom.  There is a huge emphasis on team and group projects, and the excellent teacher is often seen as the one where energy runs high in the room, rather than examining student behaviors and conversations. During the majority of my high school experience, most classes had a participation grade. If I did not speak in class I was guaranteed nothing higher than an 80% for participation, regardless of the fact that the rest of my work was A-work. I despised the participation grade. Some teachers pride themselves on their use of the Socratic method, but research has indicated that it’s execution this can offer the opportunity for gender bias: male students are more likely than female students to shout out or offer answers to questions, regardless of if they are correct. Teachers, in turn, are more likely to respond to those students and the quiet students are left in the dust.

I want to make perfectly clear that I am in no way, shape or form suggesting that classroom participation, presentations, and conversations should be abandoned, far from it! All of these skills are important and required for any field and for success. At the same time, if we are trying to reach all students in a way that they learn best, then we have to offer comfortable environments for the introverts in addition to the extroverts.

present
One of my extroverts discussing the solution to the problem. All students in this group worked on the same problem in pairs, then came to consensus before presenting to the class

Science is all about collaboration and presentation. Students who think otherwise are in for a very rude awakening as they approach their senior year of college and enter the workforce or graduate school. A method I have recently adopted is whiteboarding. At the spring meeting of the Chicago Section of AAPT, Kelley O’Shea presented on standards-based grading in physics and lead a workshop on whiteboarding methods. (See her blog!) One of the most important aspects of whiteboarding (and teaching, for that matter) is fostering an environment where it is safe to share and safe to be wrong. In the lab setting, this consists of all of the students putting their lab results on a large whiteboard and standing in a large circle. Students comment on similarities and ask questions about differences on the boards.


whiteboard1
Sample board and commentary from students. Students assess each other’s final answers and reasoning in addition to the quality of the presented work. 

I have used this method in my teaching, but I have also included a variation on the model. Occasionally (and in the interest of time and space) I have students circulate the room to examine each of the boards. They are still asked to consider similarities and differences, but I ask them to write questions and comment down on a smaller whiteboard next to each of the large ones. After we have done this, students return to their boards, read the feedback and then I open the floor to comment on similarities and differences. This provides the introverts with a huge advantage: they still get to collaborate in their small groups, but they receive the wealth of information in the large group as well as having another avenue to participate in the whole group discussion.


The second whiteboarding method I find to be highly effective with my introverts, shy students and students who struggle is what Kelley fondly dubs, “whiteboard speed dating”. In this exercise, students are paired at a board and the entire class is given the same problem. Here’s the catch: the problem is goalless, it does not end in “calculate the _____”. Students are two write anything on the board they can (diagrams, equations, graphs, etc) in the time allotted (1-3 minutes). When time is up, partners split, everyone moves around the room to an adjacent desk and now they have a new board, a new partner, and a new perspective. The first time I tried this I, admittedly, was anxious for my most introverted student. She did not speak. ever. even to me. ever. even when asked a question. about anything. Within 3 rotations she was explaining the problem to her partner, and I’ll add: not a student she typically worked with. Working in this manner gave her the confidence to collaborate with another student. Would she get up in front of the class and explain the problem? Not today. But maybe eventually.