
One of the struggles this year with my students has been linearization. Maybe it’s because I ditched Unit 0: Linearization because I wanted them to enjoy physics instead of getting bogged down in the math. Maybe it’s because I was panicking that their skills, overall, weren’t where I wanted them to be. Maybe it’s because unlike in previous years, this group of students were unable to transfer the skills from the labs to FRQs. Either way, I had a clear problem on my hands and I needed to solve it. So I decided to do a skill blitz.
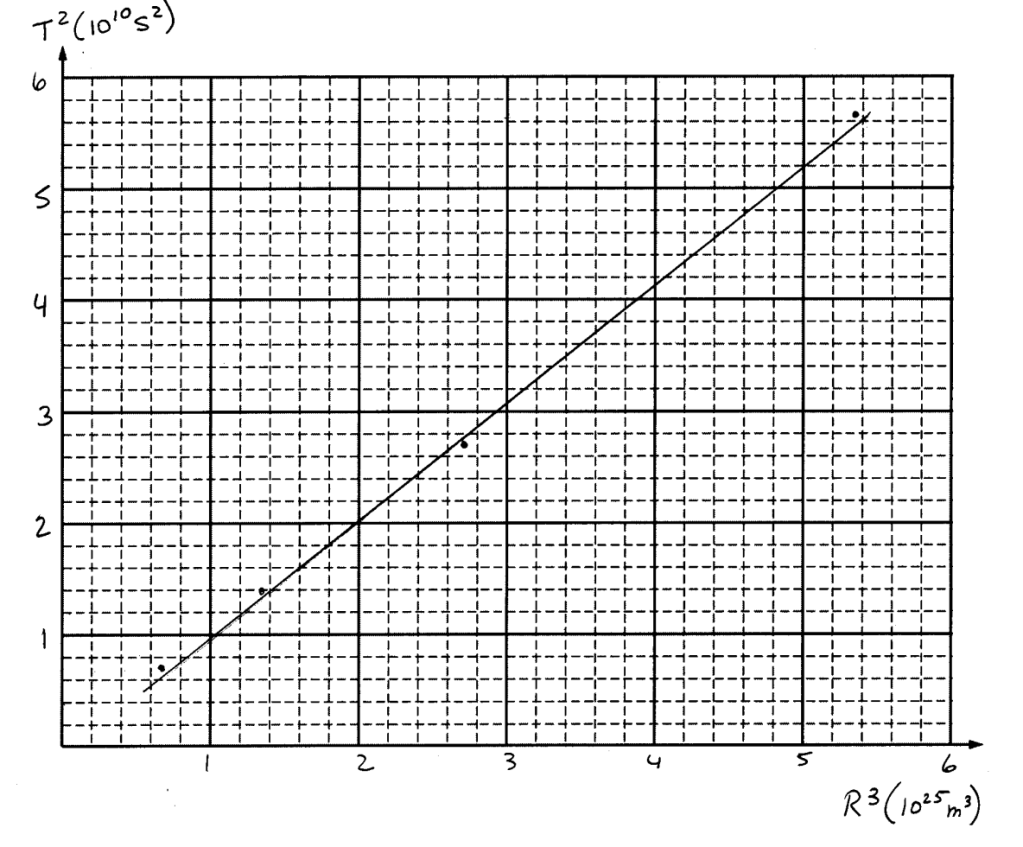
I went through old AP FRQs and settled on the lab FRQ from 2011, 2018, 2025, 2015 and 2005. I printed the page with the data table only on different colored paper for each year. Then I gave students a document with the following table (full doc here):
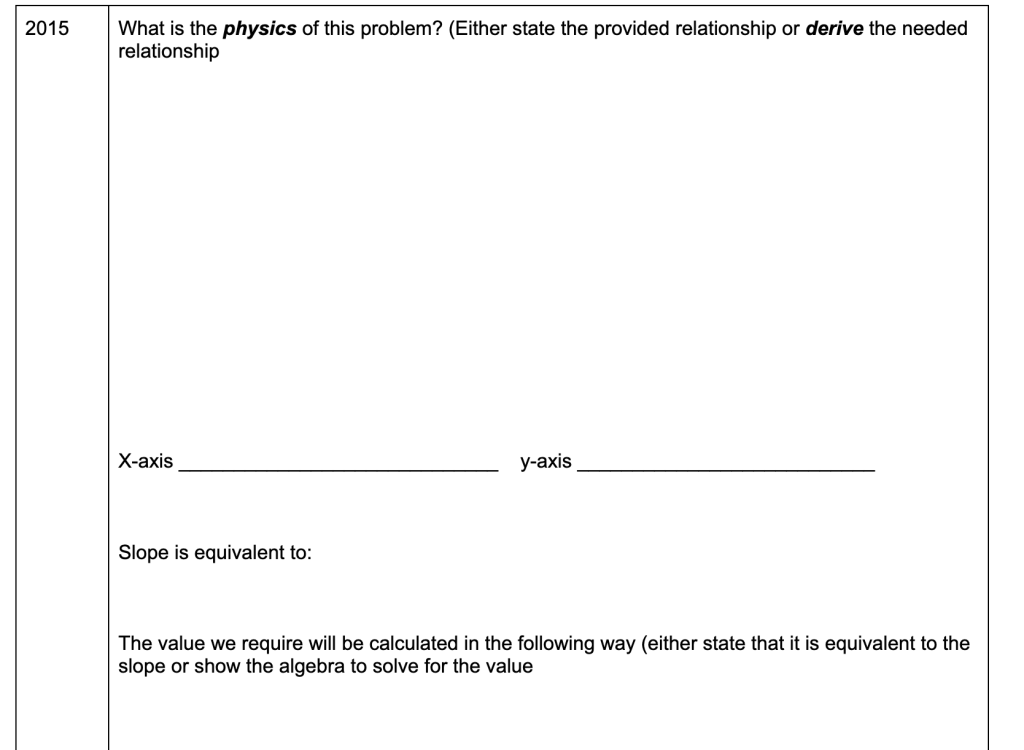
Students are asked to do the derivation, state the axis labels, the slope and then whatever algebra, if necessary, to obtain the necessary value.
When students believe they’ve completed the task, I come check their work. If it’s correct they go obtain the next problem. If it’s incorrect I provide some feedback/clues and they continue.
In hindsight, I should have provided the 2018 problem first, so what happened was this. I gave them 10-15 minutes to grapple with the 2011 problem. After a while and noticing students were spinning their wheels, I went ahead and walked them through the problem. Then I let them get started on the next one. Once they got started they were on a roll. I realized during class that I had actually managed to select 5 problems that also represented the entire scope of the course!
I wanted students focused on speed and accuracy. They were allowed to use notes, but obviously that could slow them down (and wasn’t overly helpful with this particular task). First group to complete all 5 tasks gets to pick treats for when we watch Interstellar next week!
I’m thinking about how I might do this blitz with the other styles of questions. Maybe for continued review next week. We shall see!

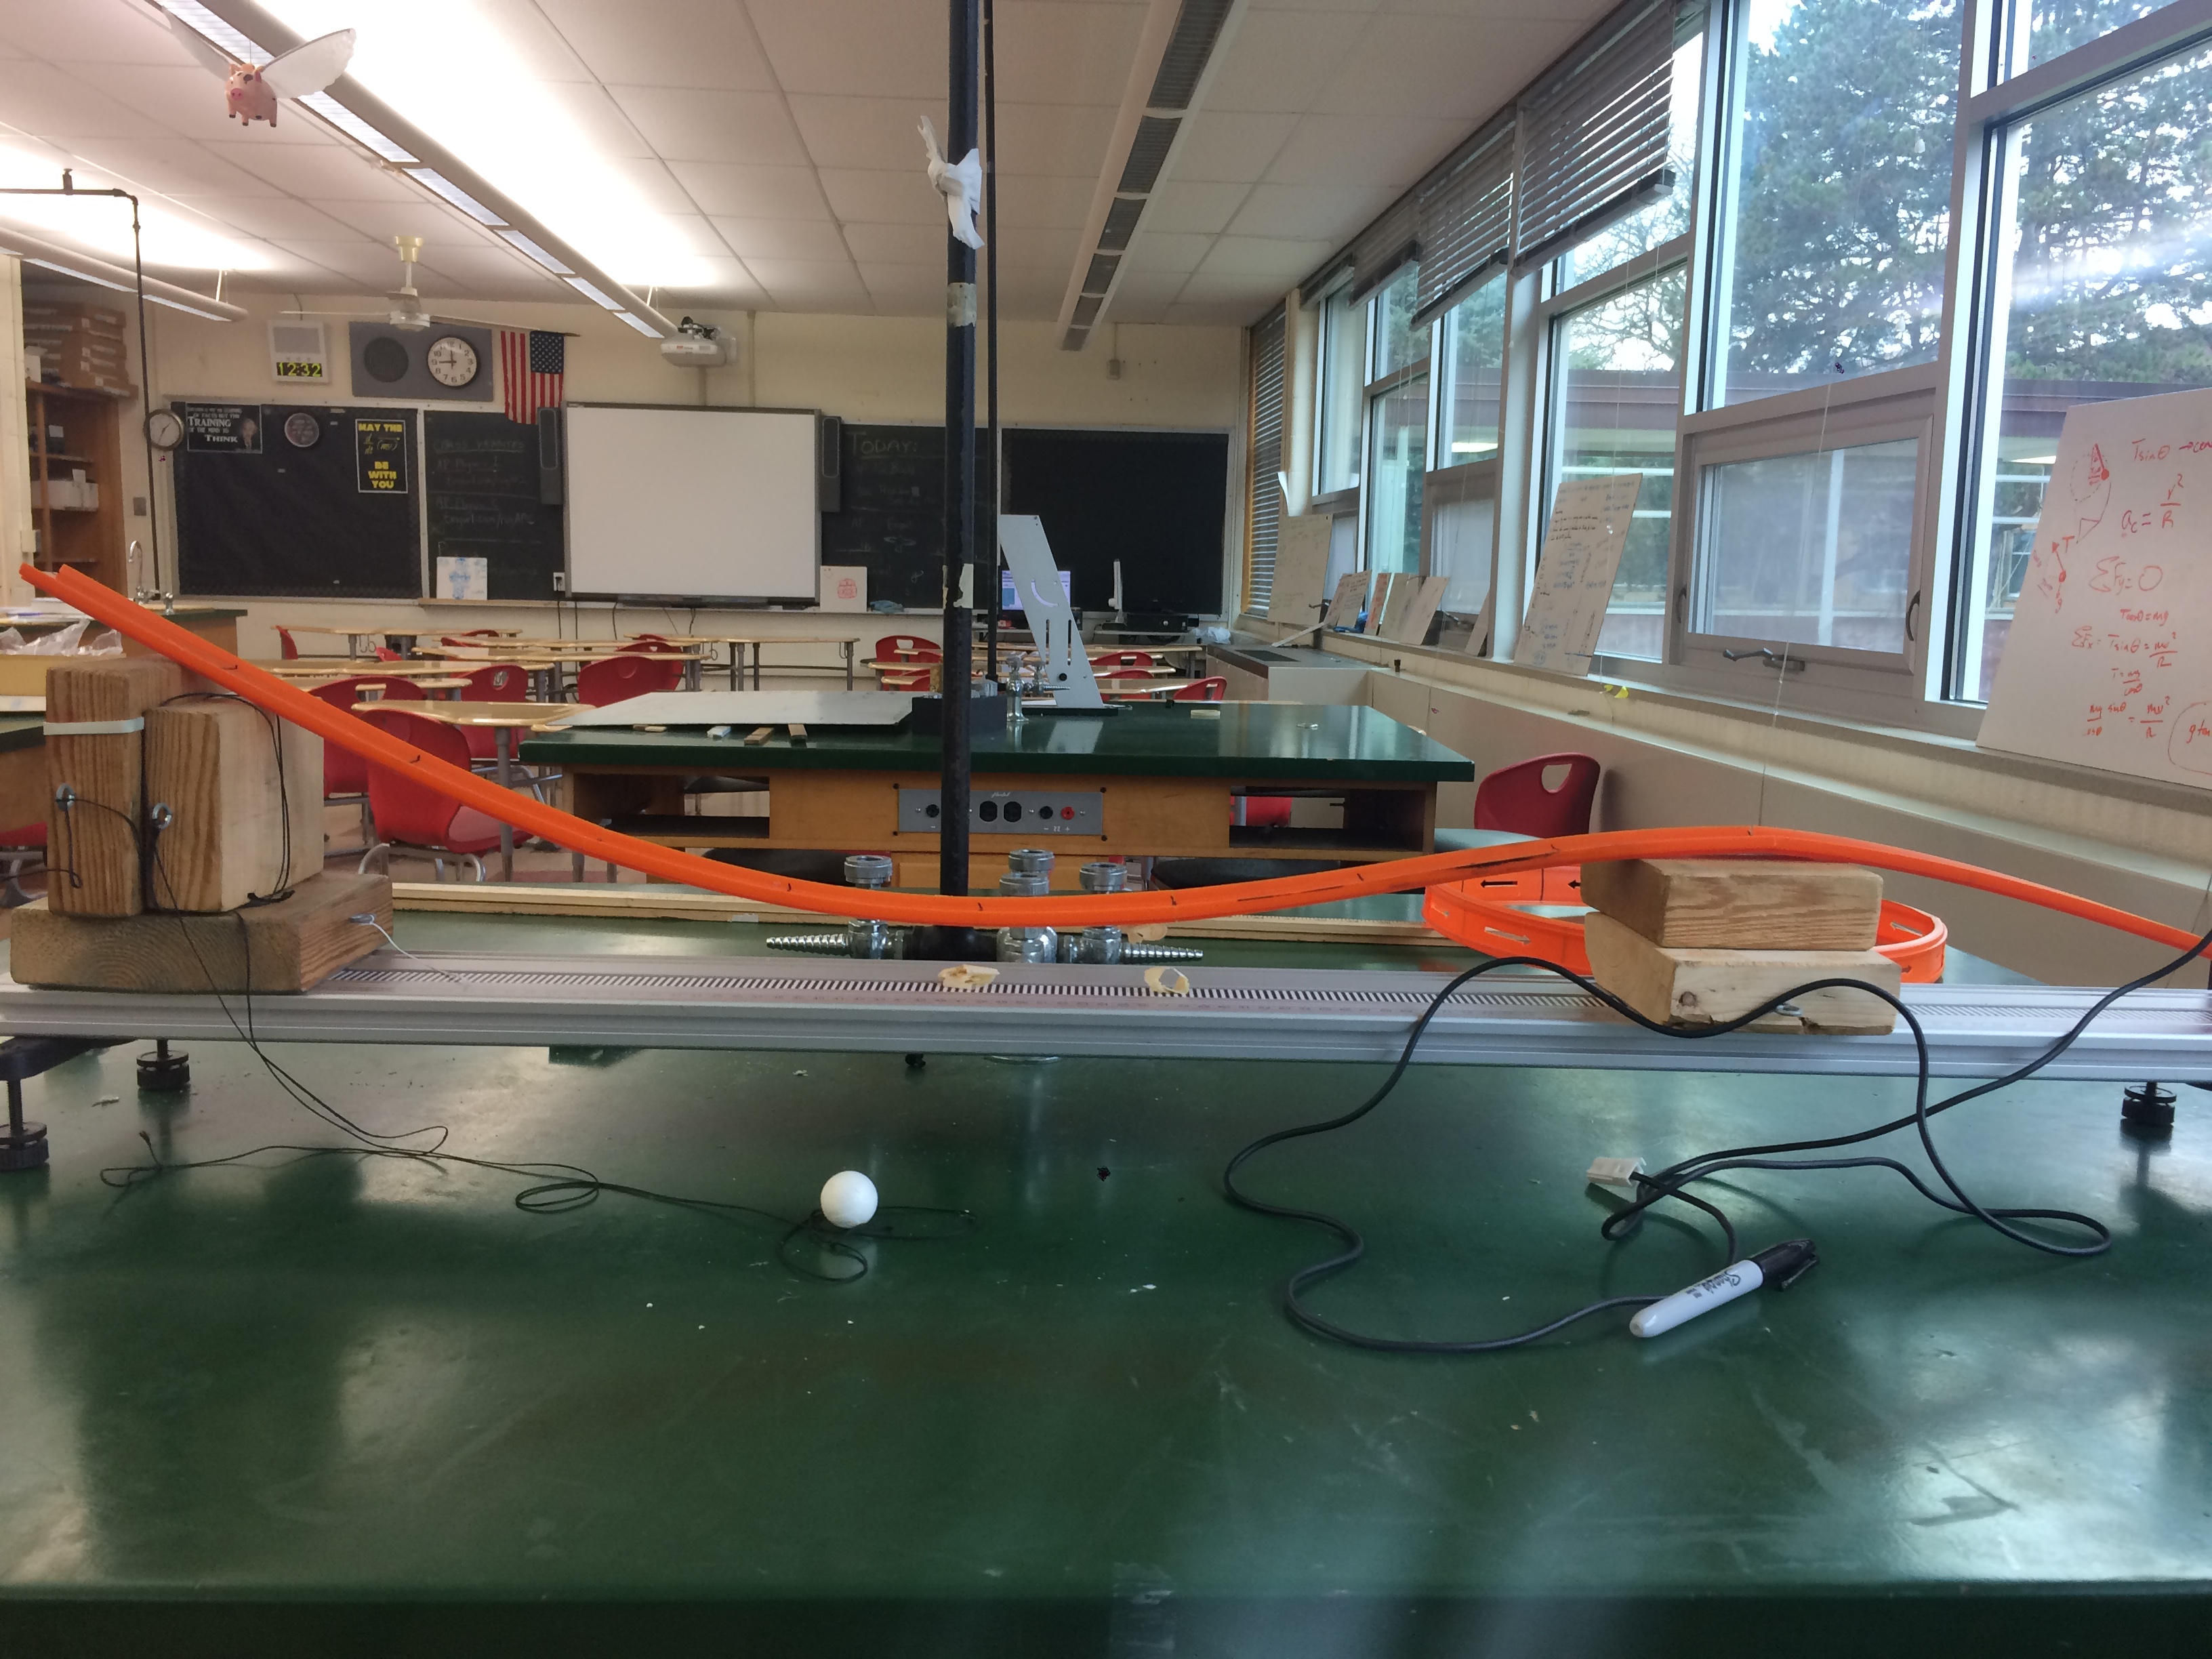
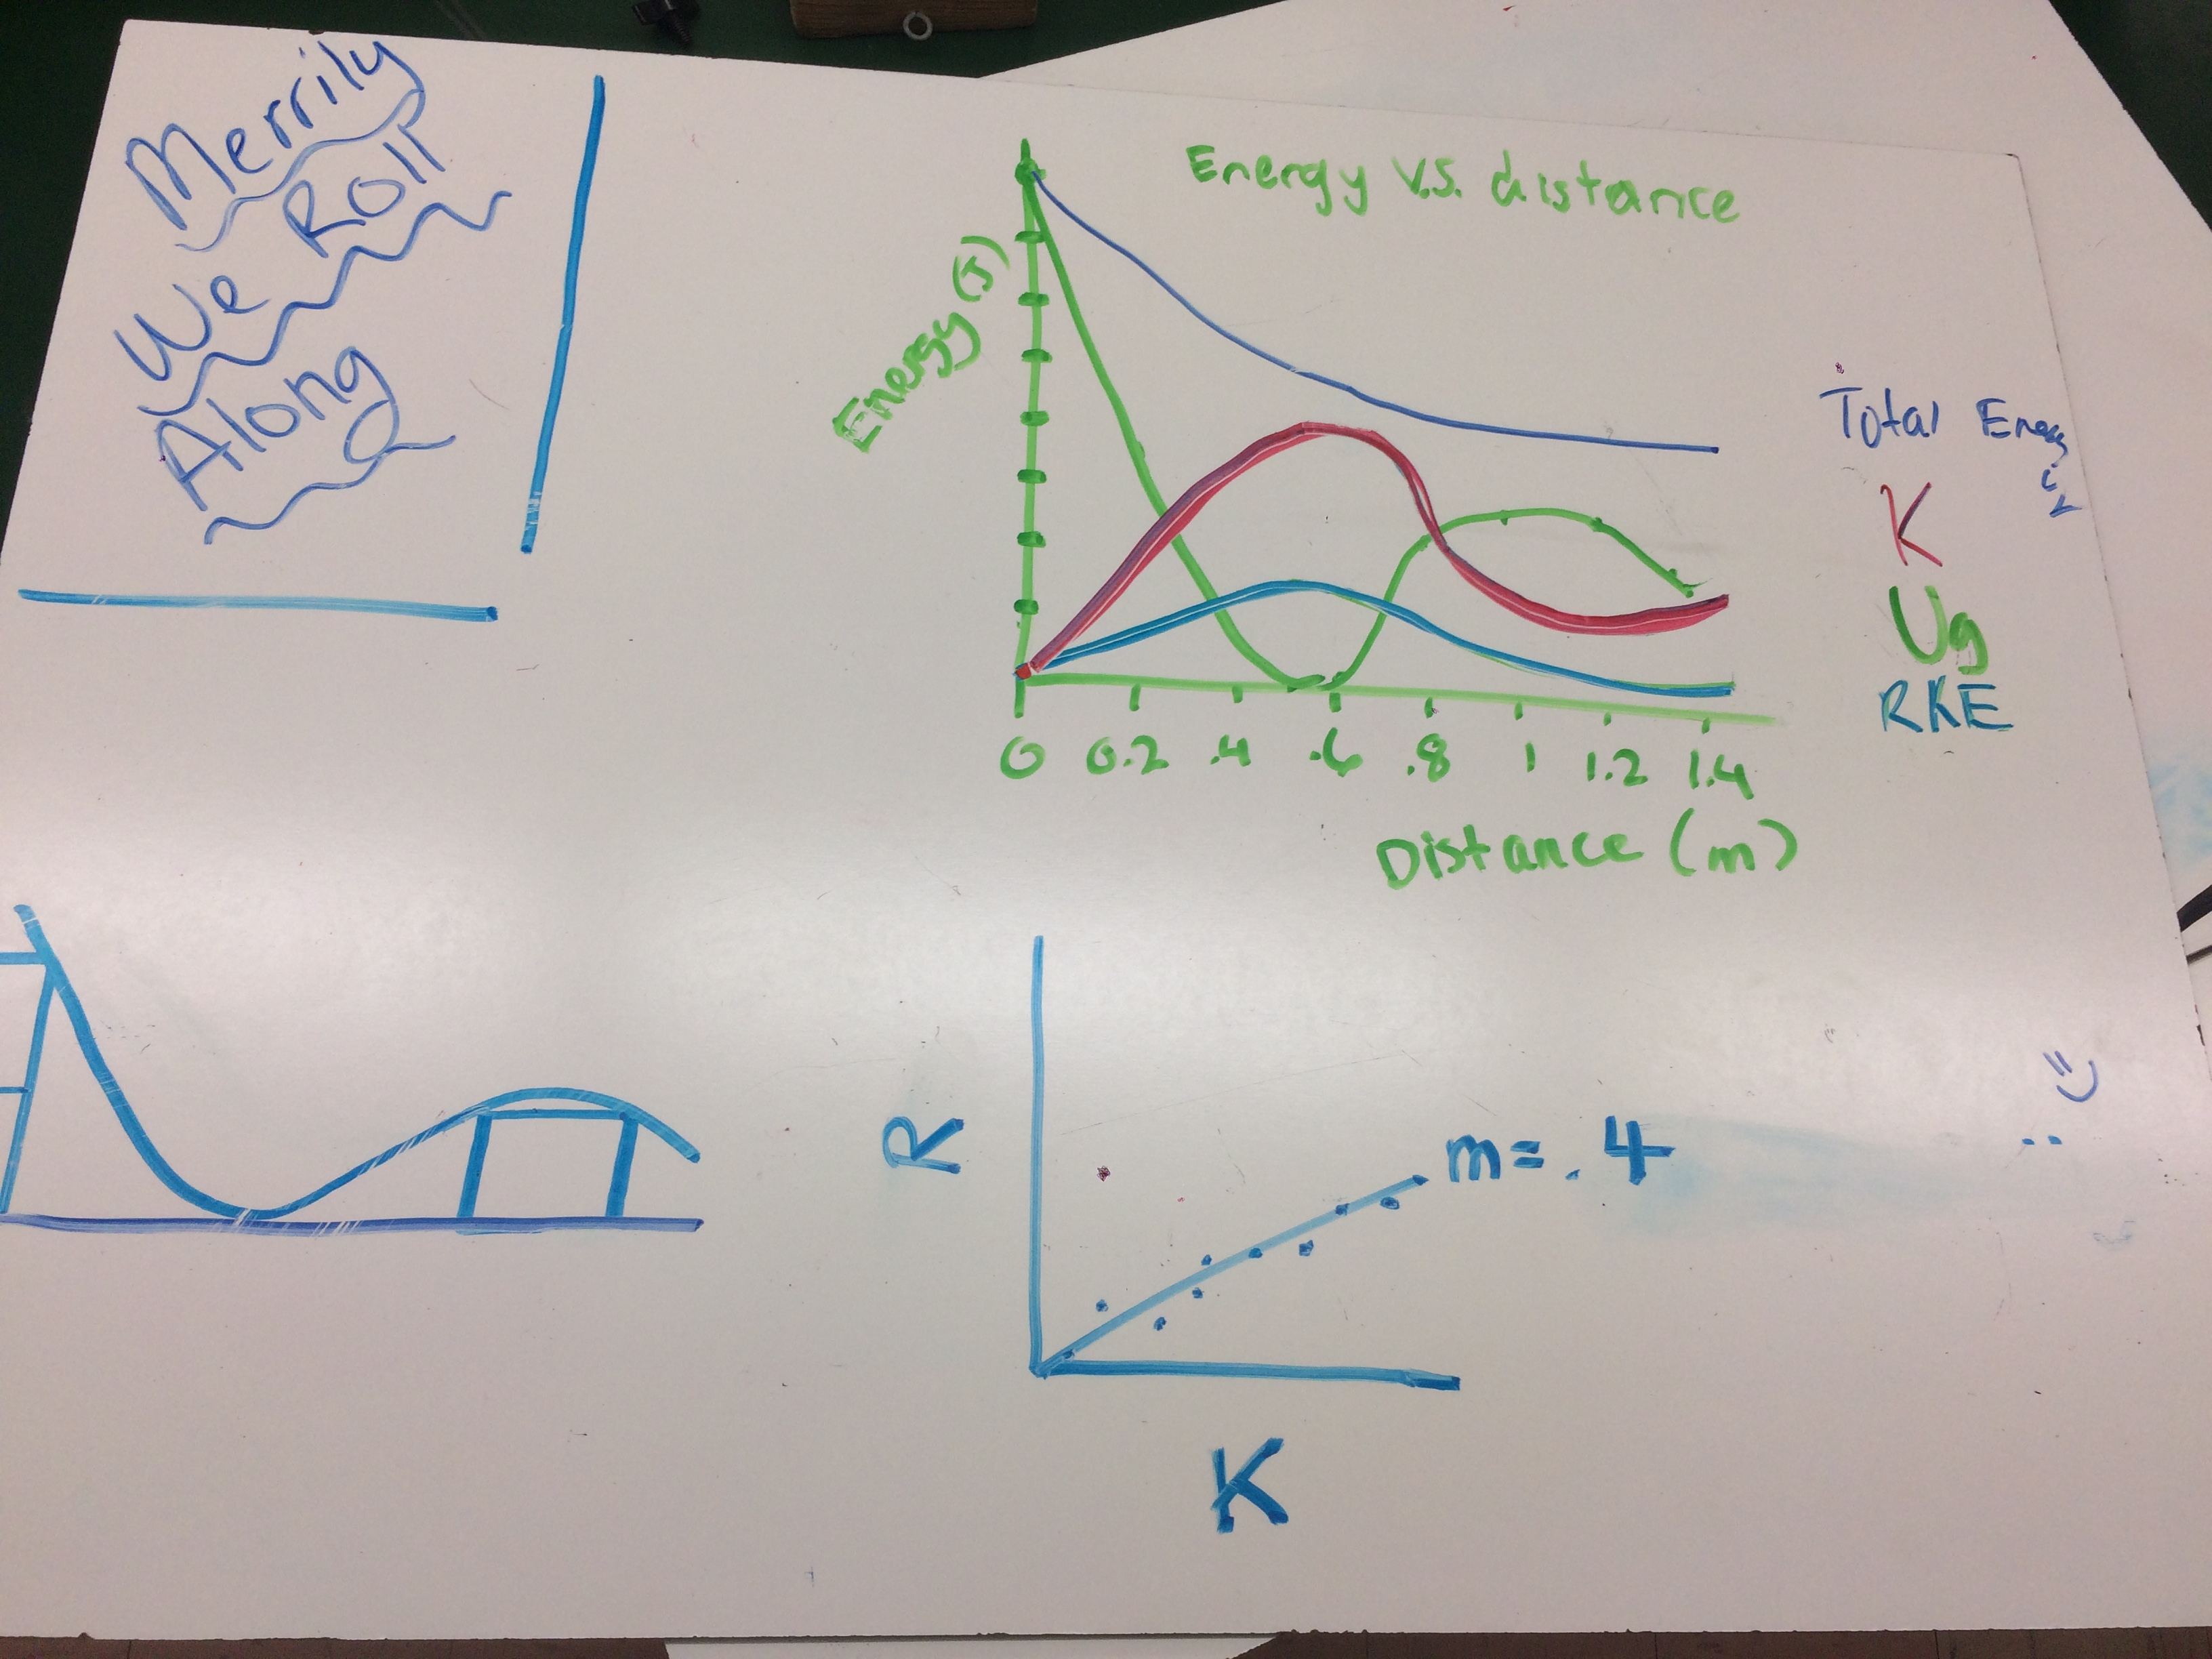
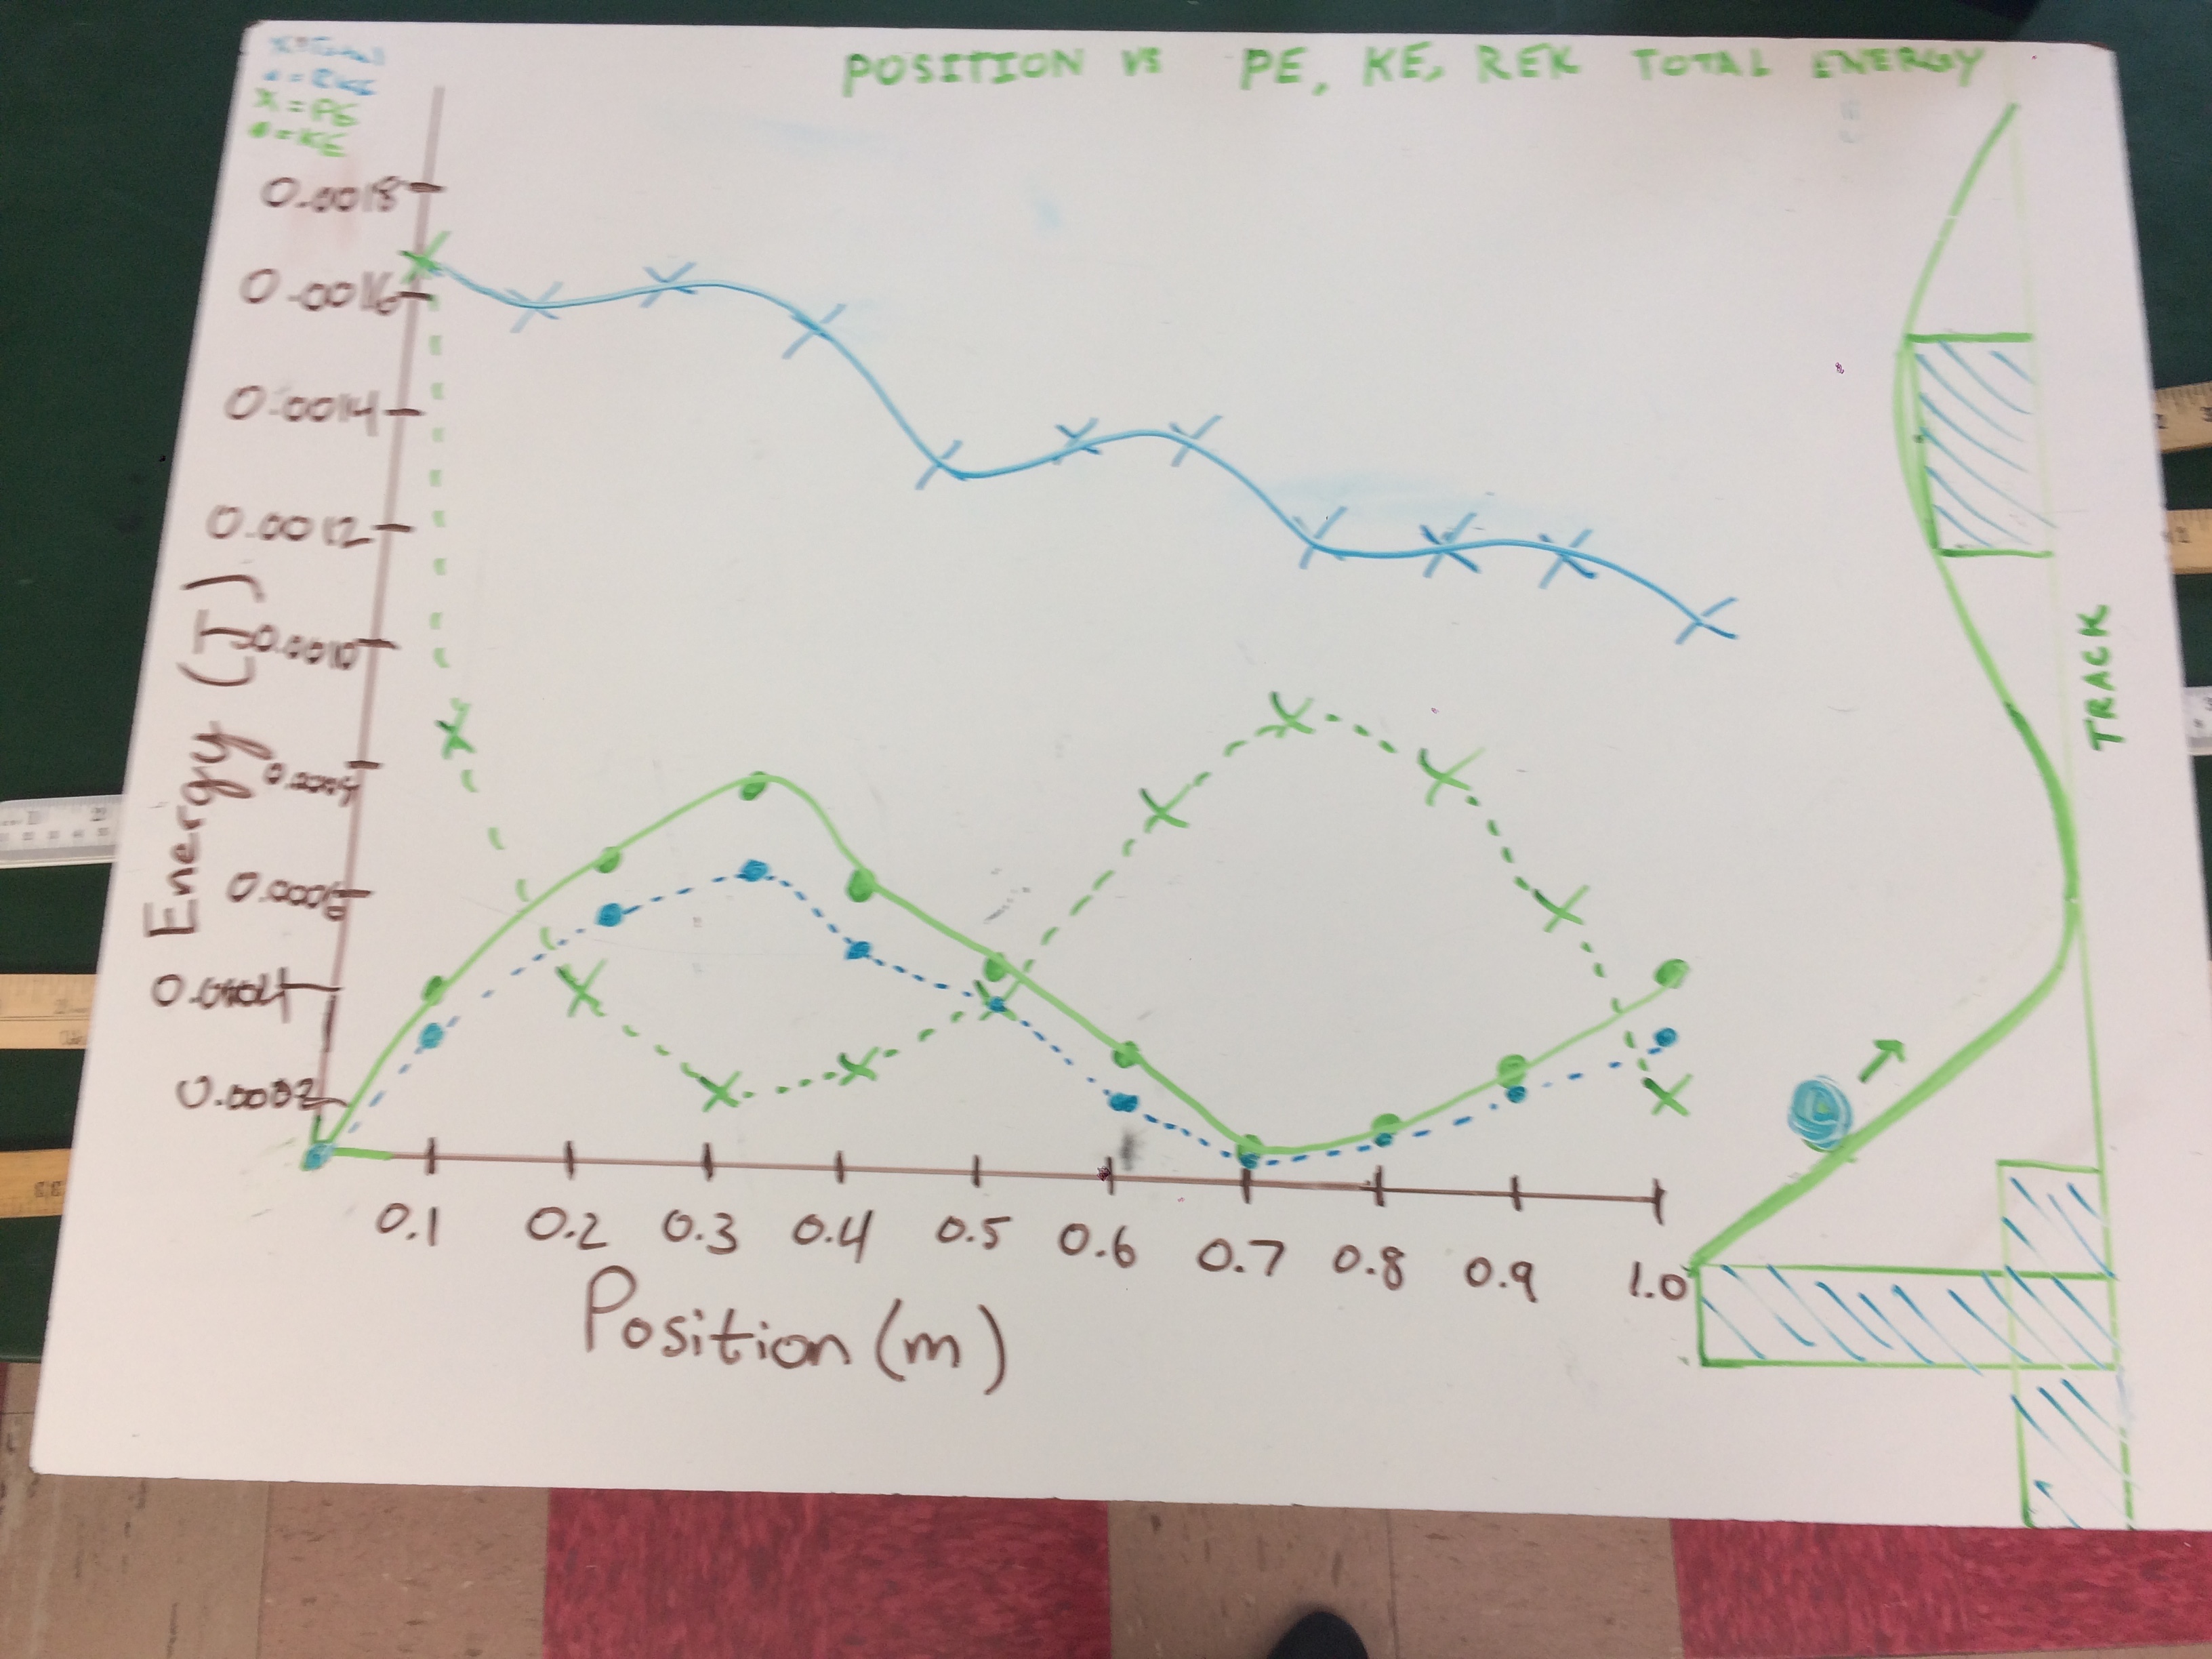 Do you notice anything? The largest drop off in TME corresponds to the moment where the ball is at the bottom of the hill. This serves as a great review of work and circular motion. Frictional force, as we know, is dependant on normal force. The normal force of the track changes and corresponds with its shape. We can actually predict the drop-offs in TME based on shape and even determine the work done by friction.