
When I was in college my E&M professor introduced me to the falstad apps. It was literally this guy who created a bunch of different JAVA sims. E&M is notoriously challenging due to needing to think and reason in three-dimensional space, so we were encouraged to use the apps to help us visualize static fields.
When I started teaching I decided to poke around and see what else Falstad had created. One of his simulations I use year over year is his ripple tank. It’s incredibly powerful and way less cumbersome than setting up the actual water tables (which was just unfeasible being the only physics teacher with 3 preps)
I just finished my intro activity today so I figured I might as well share. You can find the simulations here.
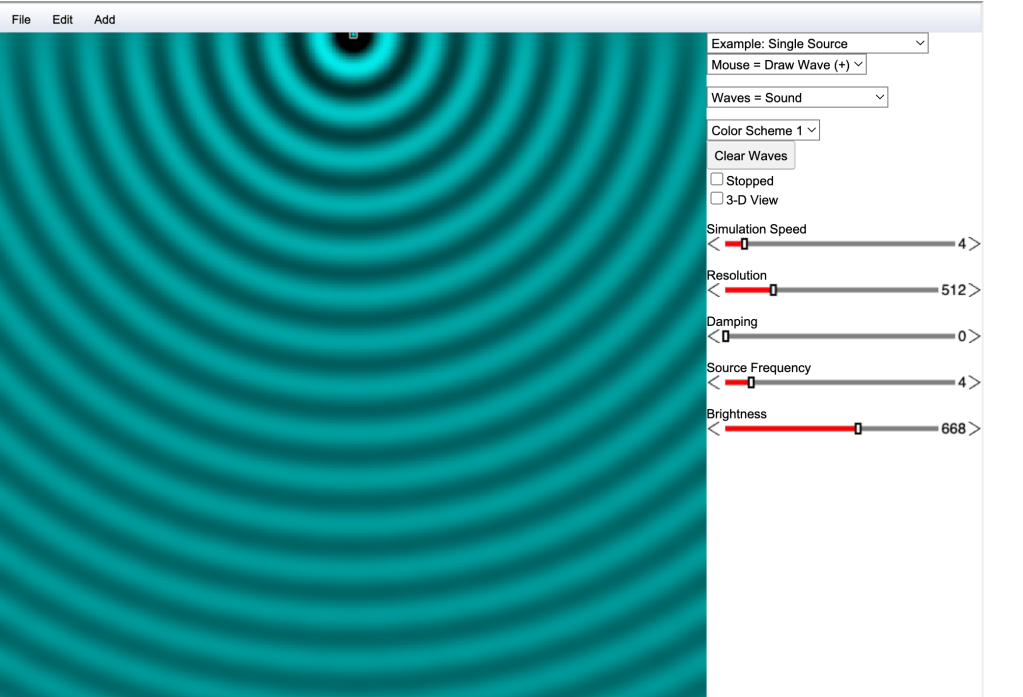
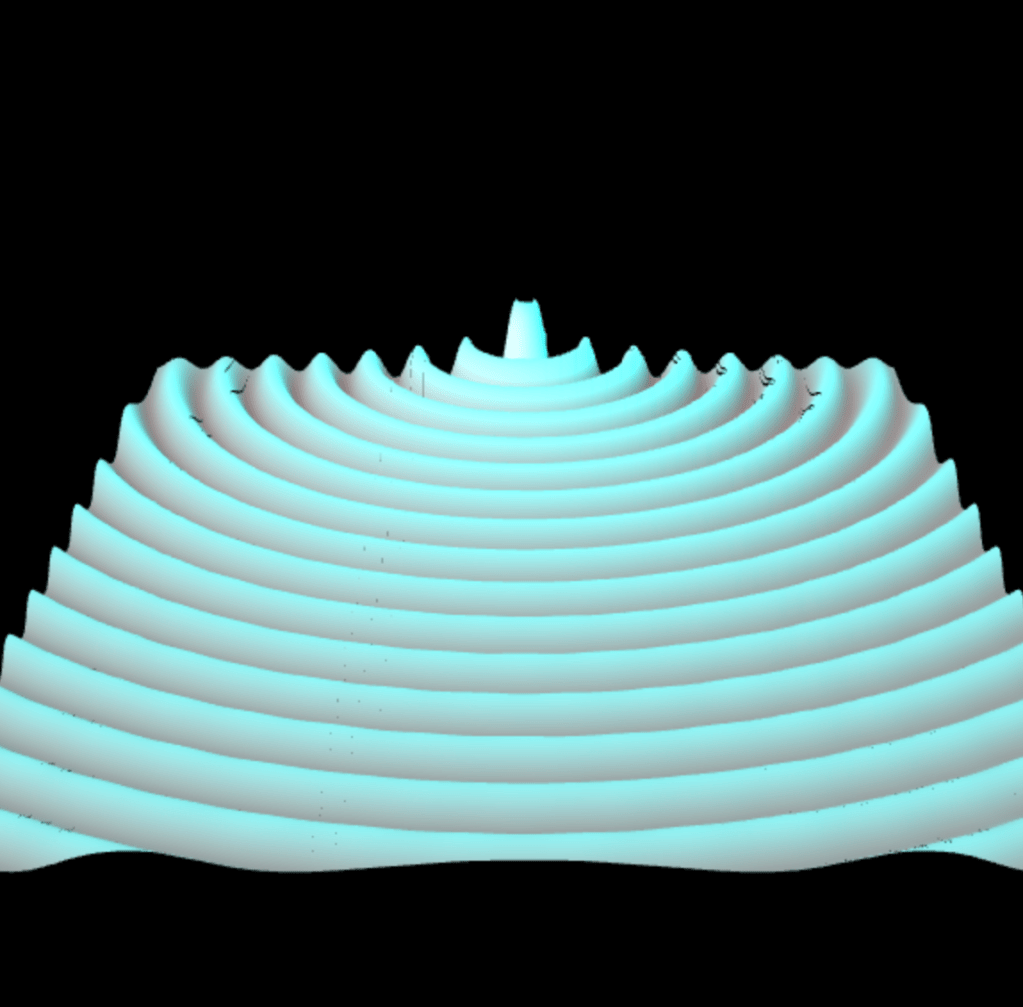
When the app opens it’s pretty simple. A “faucet” wave like the one in the Phet sim is present. You can see the sliders to adjust for damping and frequency. You can move the source where ever you like and can even toggle into 3D view
What’s pretty awesome is the list of “examples” you can select from the drop down menu.
Single slit, double slit, two-sources, refraction, total internal reflection and a whole slew of topics. You also have complete freedom to add to the simulation using the “add” menu bar at the top.
For my students, we start our waves unit in the following way.
First, we watch the slo mo guys film this ginormous 90 foot wave... with ducks…. which is awesome.
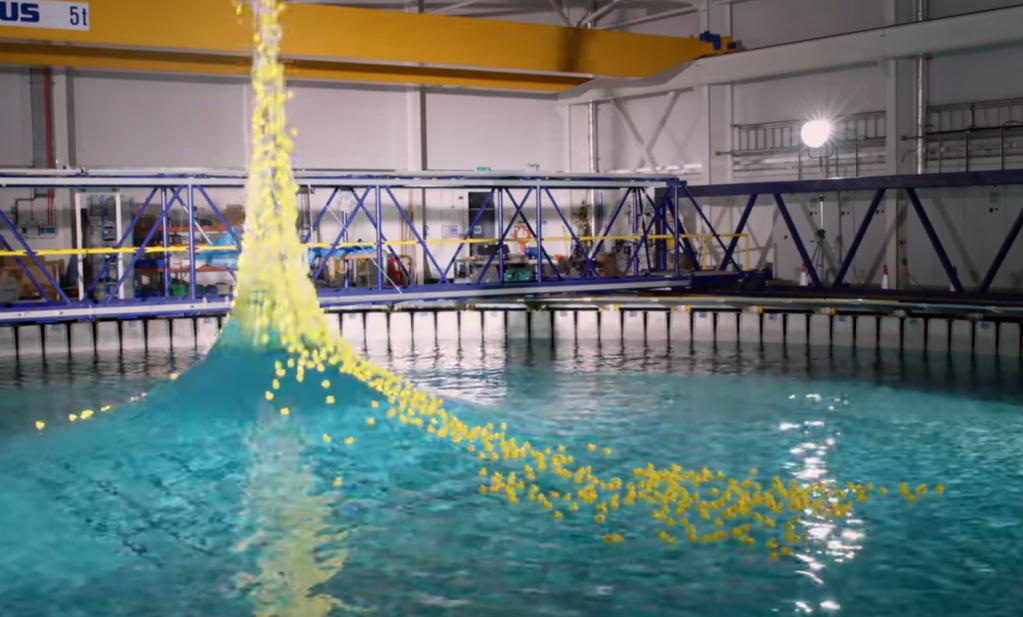
There’s a lot of really great phenomena here. From constructive interference, to refraction and lenses (pay attention to the grid image in the column) to the idea that waves transport energy, not matter.
Next, students head to the sim. I provide them directions on this document and the record their observations on this one.
This activity typically takes a class period and a half. For my advanced students they can usually finish in a class period or I can assign the rest for homework.
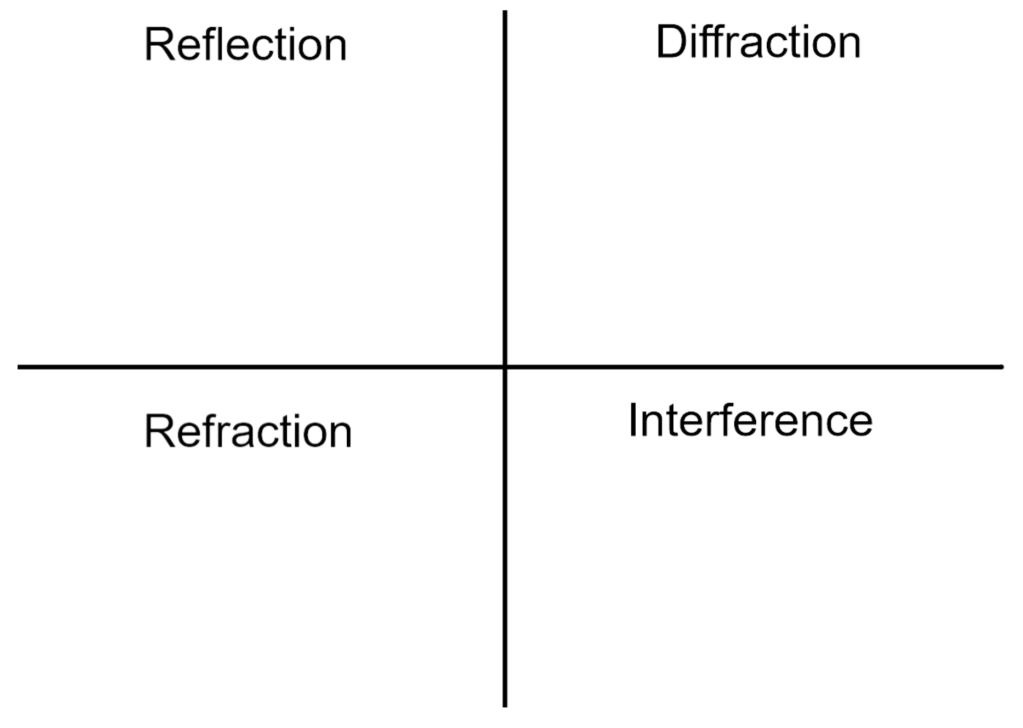
When students return the following day, I put this graphic organizer up and prompt them to write their own definition of the behavior based on their observations and a diagram to go with it
During the unit I come back to this app quite often.
We discuss how the design of an auditorium is based on nodal lines
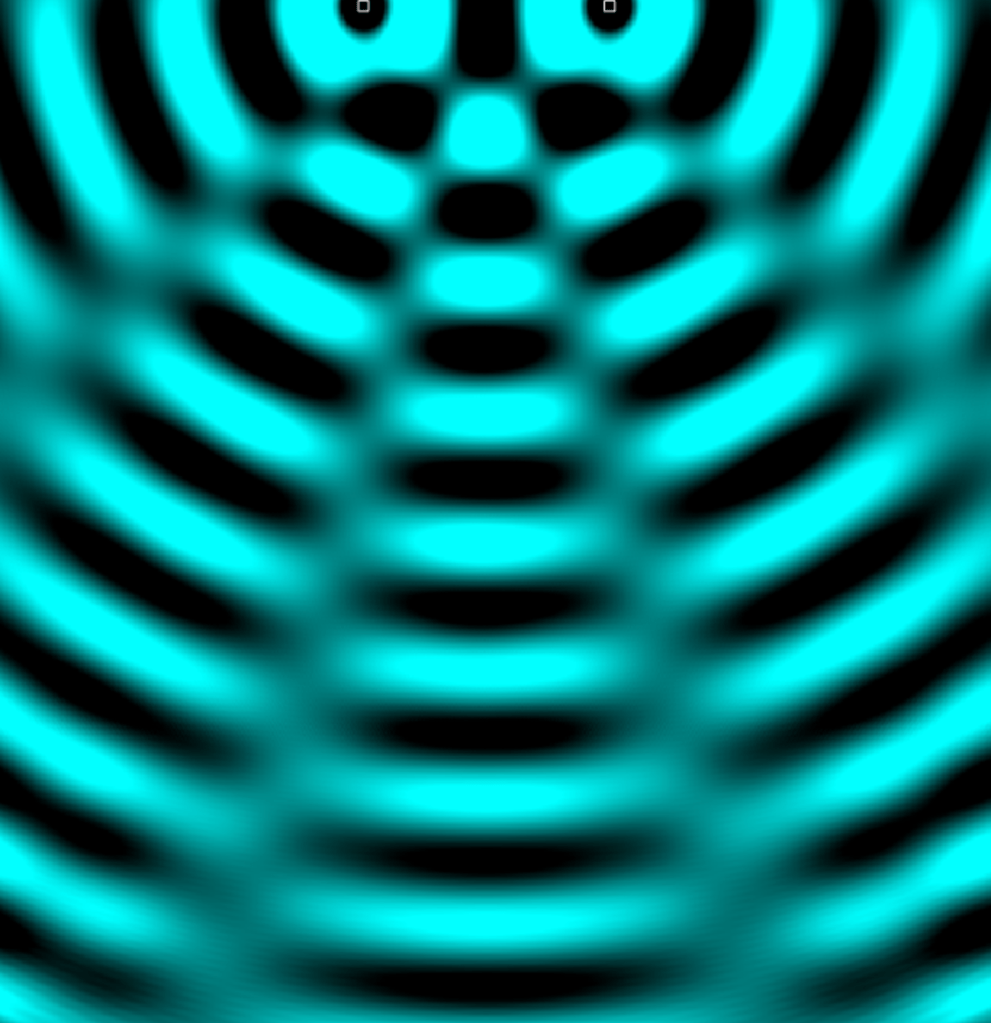
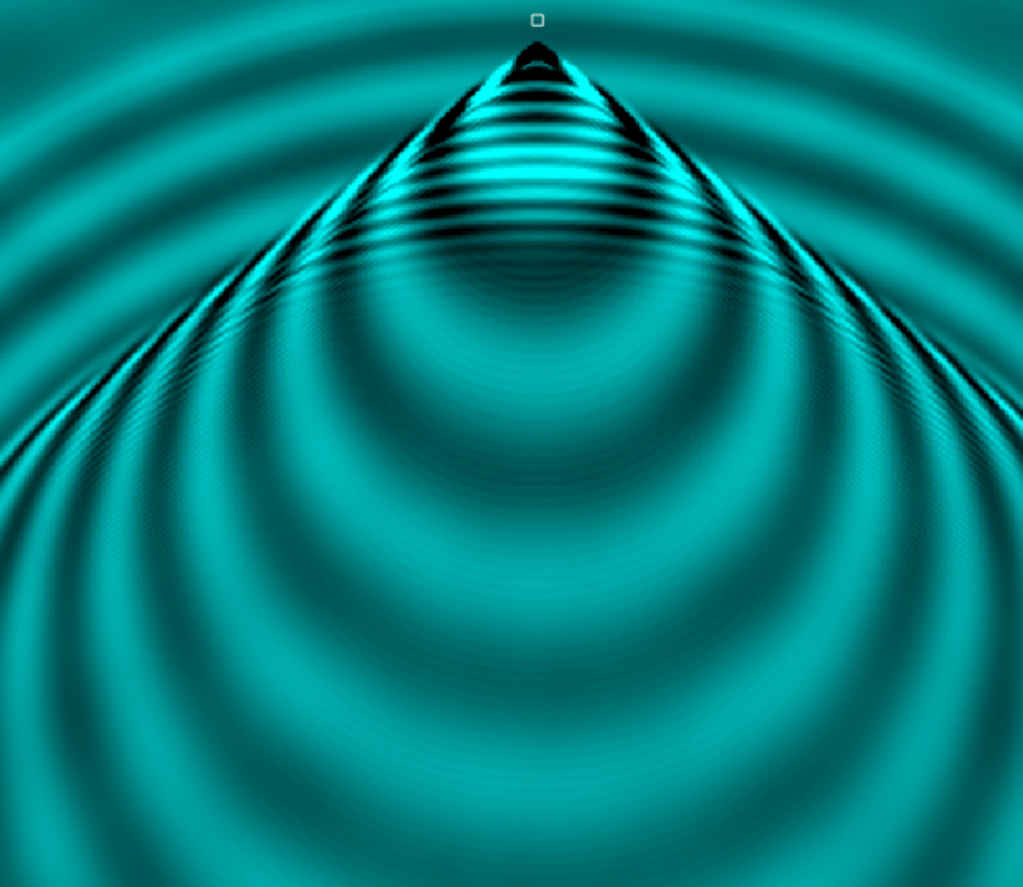
I can drag the single source around to demonstrate doppler effect and sonic booms
If there’s a phenomena I want students to be able to observe, pause and manipulate… there’s usually a way to do it.
